
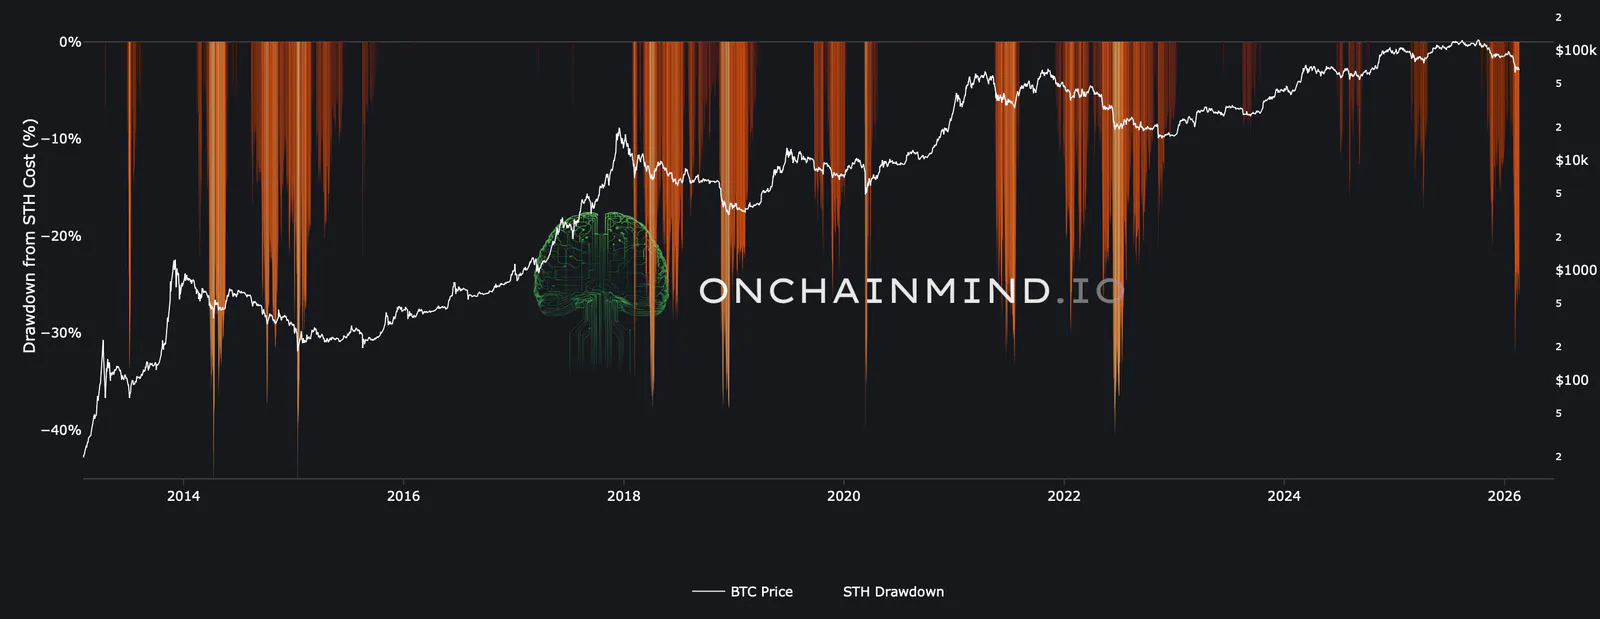
Bitcoin has been under pressure for months, and not just a little. This is one of the most significant drawdowns we’ve seen in years.
For over 100 days, it has been trading well below what recent buyers have paid, putting the market’s most reactive investors under sustained stress.
This isn’t just about price falling. It’s about understanding who is in pain, for how long, and what that tells us about the cycle.
In this article, I break down the depth of this drawdown, explain why the time spent underwater matters as much as the severity, and show what my composite Bitcoin Ω-Score reveals about where risk and opportunity are forming right now.
Insights at a Glance
The Capitulation Threshold: Bitcoin has dipped into a zone that has historically marked deep pain for the most reactive investor cohort.
Time as the Final Catalyst: It’s not just how far price falls, but how long it stays there. We explore the key periods that have defined past cycle turning points.
Worst-Case Equilibrium Zones: History gives us clues on potential floors, showing where selling pressure tends to exhaust itself.
Ω-Score Compression: Our composite risk indicator is at historically low levels, but it’s the time spent in this zone that signals the real opportunity to scale in thoughtfully.
Join On-Chain Mind to read the rest of this analysis and get full access to Chart Studio.
- 3more charts
- 1,600more words
- 4more sections
- Premium Updatesevery update and monthly Q&A, in full
- Chart Studiofull access to every OCM chart and metric
- Weekly newslettersthe analysis in your inbox, no ads