

September has been a strange month to write into. We have bounced, and bounced quite hard off the lows, yet we are still sitting roughly 38% below the highs and almost nobody actually feels safe. That tension, price recovering while conviction has not, runs through nearly every question you sent in this month. The first one asks it bluntly: has the bounce already eaten the value?
Underneath the price, the network itself is under real strain. Hashrate has been sliding for months, and we talk about whether miners are about to crack. And for the first time in a long while we had an actual consensus fight to talk about, with mining pool centralisation, large OP_RETURNs, BIP-110 and a chain split all arriving in the same window.
Then there is the macro layer. A lot of you are watching Michael Howell for the liquidity trough, a lot of you want to know whether the sidelined capital story shows up anywhere in the data rather than just on podcasts, and several of you have quite reasonably asked whether Bitcoin's golden era is already behind us, whether we have quietly traded outrageous gains for merely exceptional ones. The options market has its own view on all of this, and it is not the same view spot is taking.
A lot of ground to cover this month, so let us get stuck straight in.
Cheap, Fair, or Already Gone?
Question: Cutting through everything else, where do the core on-chain valuation metrics actually put us right now? Are we cheap, fair, or has the bounce already eaten the value?
My Thoughts: Good, straight into some numbers.
My answer is that we have moved from "historically cheap" to "still cheap, but no longer a gift". At the summer lows we were trading below the 200-week moving average and sitting at low single digits on the cycle Ω-Score, which remains the single most important risk score of any chart I publish. That is the zone that has marked genuinely generational value in every previous cycle. We have since bounced hard off it and we are at 39% now.
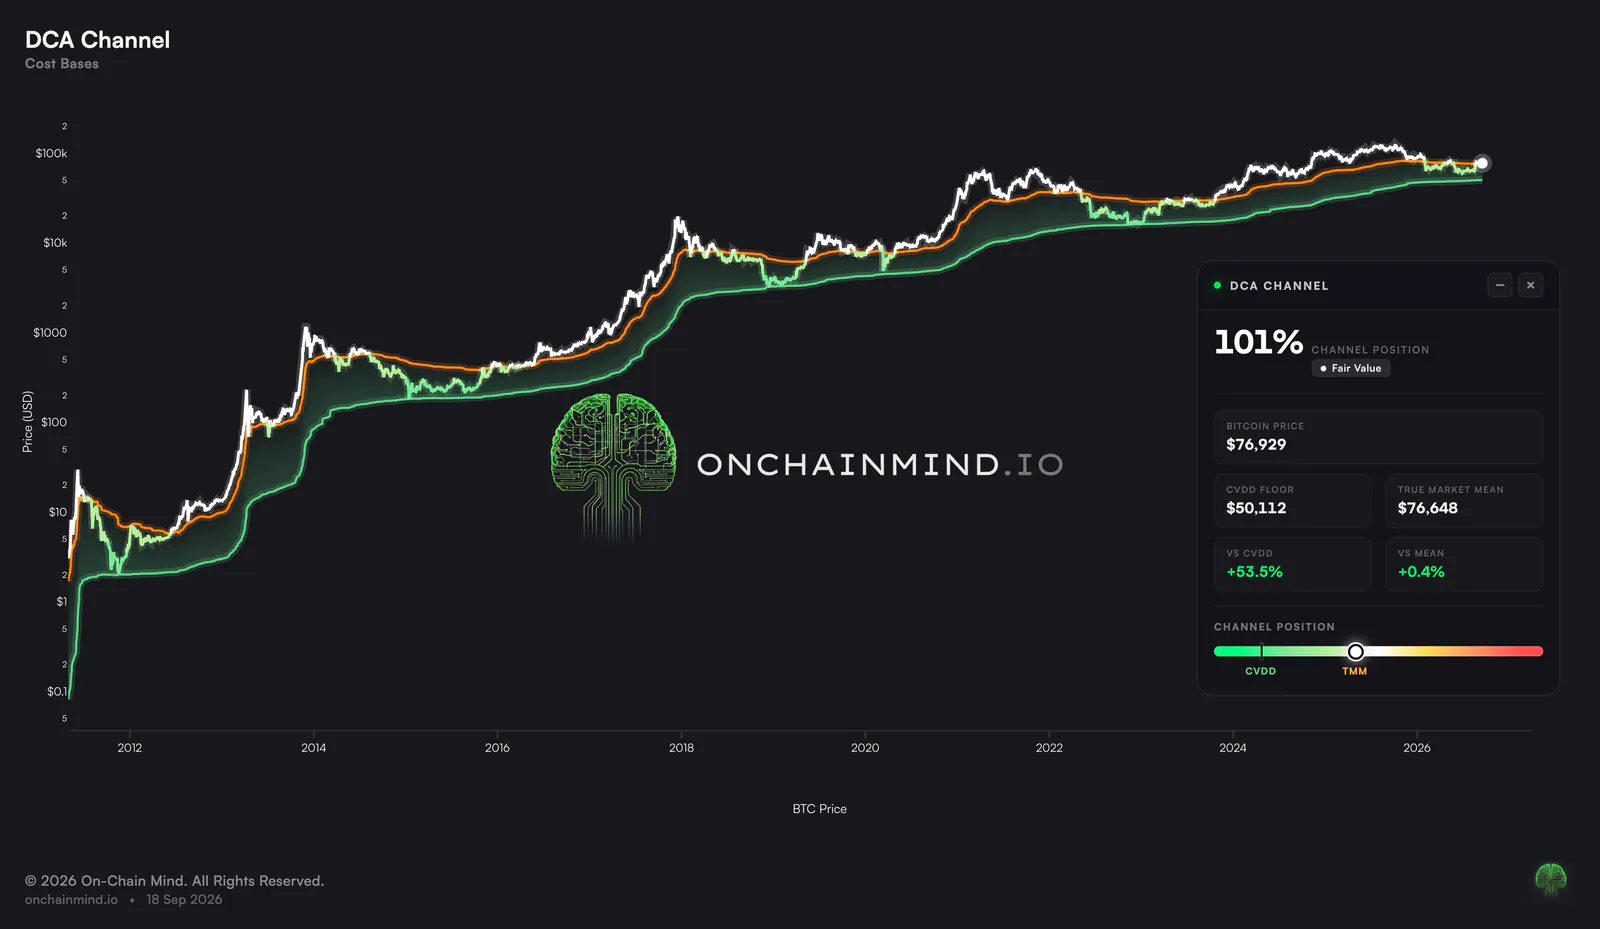
Where that leaves us is quite interesting. We have lifted off the floor, but we are nowhere near anything you could reasonably call expensive. The short-term Ω-Score was extremely overheated on our initial blast up to $77K, but that is cooling off now. On the Cost Bases dashboard, spot sits right at the top of the DCA Channel. So for me this is still DCA territory, just not sell an organ and throw the entire kitchen sink at the market territory.
So the asymmetry has reduced, but it has not disappeared. Buying down at the lows was the fat pitch, and we were talking about that all summer. DCAing here, still below 50% on the cycle Ω-Score, has been one of the best risk adjusted plays in Bitcoin's entire history.
Beyond Bitcoin: What Is Next for OCM?
Question: What is coming next on the OCM roadmap? Which new metrics, dashboards or assets should we be expecting over the coming months?
My Thoughts: Multi-asset, and far more of it than most of you are expecting.
We have just shipped an enormous update taking our on-chain coverage well beyond Bitcoin: hundreds of new and genuinely unique metrics on Ethereum, XRP, Chainlink, Cardano, Dogecoin and Litecoin, with more chains to come. Shout out to Chart Inspect as the best granular data source out there.
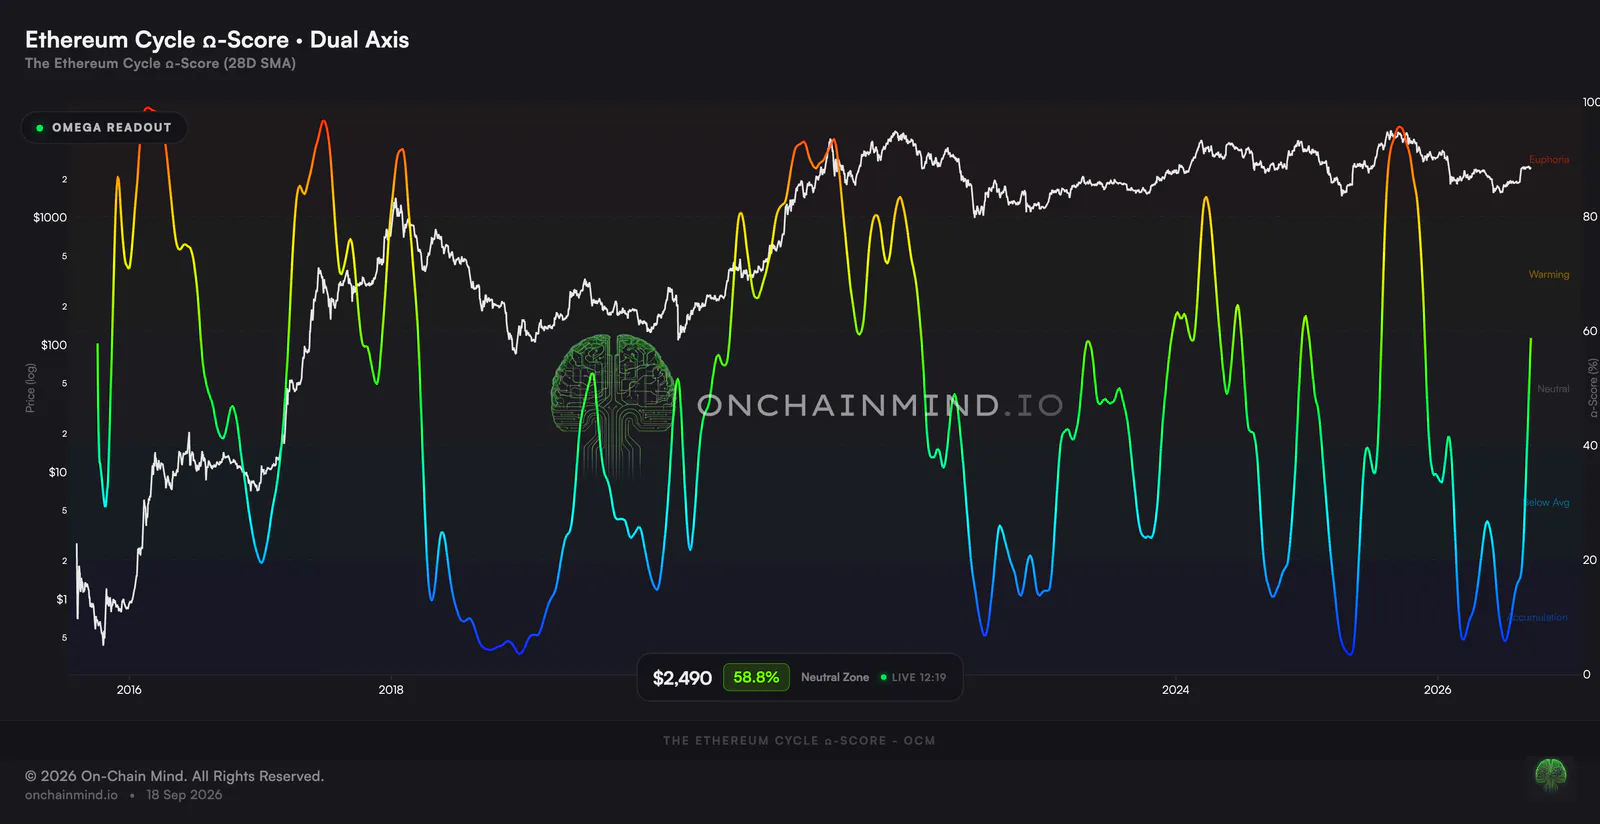
Most importantly, our flagship Ω-Score now reads Ethereum. Same model, pointed at a second chain. Both views carry over intact, Cycle and Short-Term, each built exactly as its Bitcoin counterpart is, and read against the same 5 zones from deep accumulation through to extreme euphoria. The forward-return model is rebuilt per asset, so an Ethereum reading is answered by Ethereum's own precedents. You'll be as surprised as us to find that it called the tops and bottoms to absolute perfection. On-chain and technical confluence is the most powerful tool in existence.
Capital Flows reads Ethereum too, with the ETFs and BitMine on the institutional side. Is that bid real or just a headline? You cannot answer it from price. Either they are seriously contributing to the capital flows of the ETH network, or they are not.
Then the Profit & Loss, Dormancy and Supply Distribution dashboards go beyond Bitcoin. Everyone knows what Bitcoin looks like at an MVRV or long-term holder extreme. Almost nobody knows what Litecoin or XRP looks like at their own, and the reason is that the readings were not available, not that they were not useful. Now we have hundreds of powerful and unique metrics on 6 other chains, with many more to come!
Which Alts Can Actually Outperform?
Question: Which alts can significantly outperform BTC, what are on your watchlist?
Join On-Chain Mind to read the rest of this analysis and get full access to Chart Studio.
- 3more charts
- 2,450more words
- 7more sections
- Premium Updatesevery update and monthly Q&A, in full
- Chart Studiofull access to every OCM chart and metric
- Weekly newslettersthe analysis in your inbox, no ads