
Bitcoin has this sort of hidden layer of market energy. Subtle shifts in momentum, volume, and volatility that often go unnoticed. These forces build quietly, sometimes converging to ignite a rally, other times dissipating before the market even notices.
In this article, I’ll introduce you to a new powerful indicator that provides a window into this invisible world. It doesn’t just track price; instead, it measures the strength behind every move, revealing when bullish forces are aligning, when bears are gathering, and when the market is just downright indecisive.
Insights at a Glance
Momentum Coalescence: Blends momentum, volume, and volatility into a potent oscillator, surpassing single-factor indicators in capturing Bitcoin’s market energy.
Swing Trading Precision: Downside spikes and midline crossings flag high-reward entries, with past gains up to 200% in months.
Cycle-Timing Mastery: High readings signal peaks, low ones mark bottoms, and colour shifts track bull-bear transitions, preserving capital.
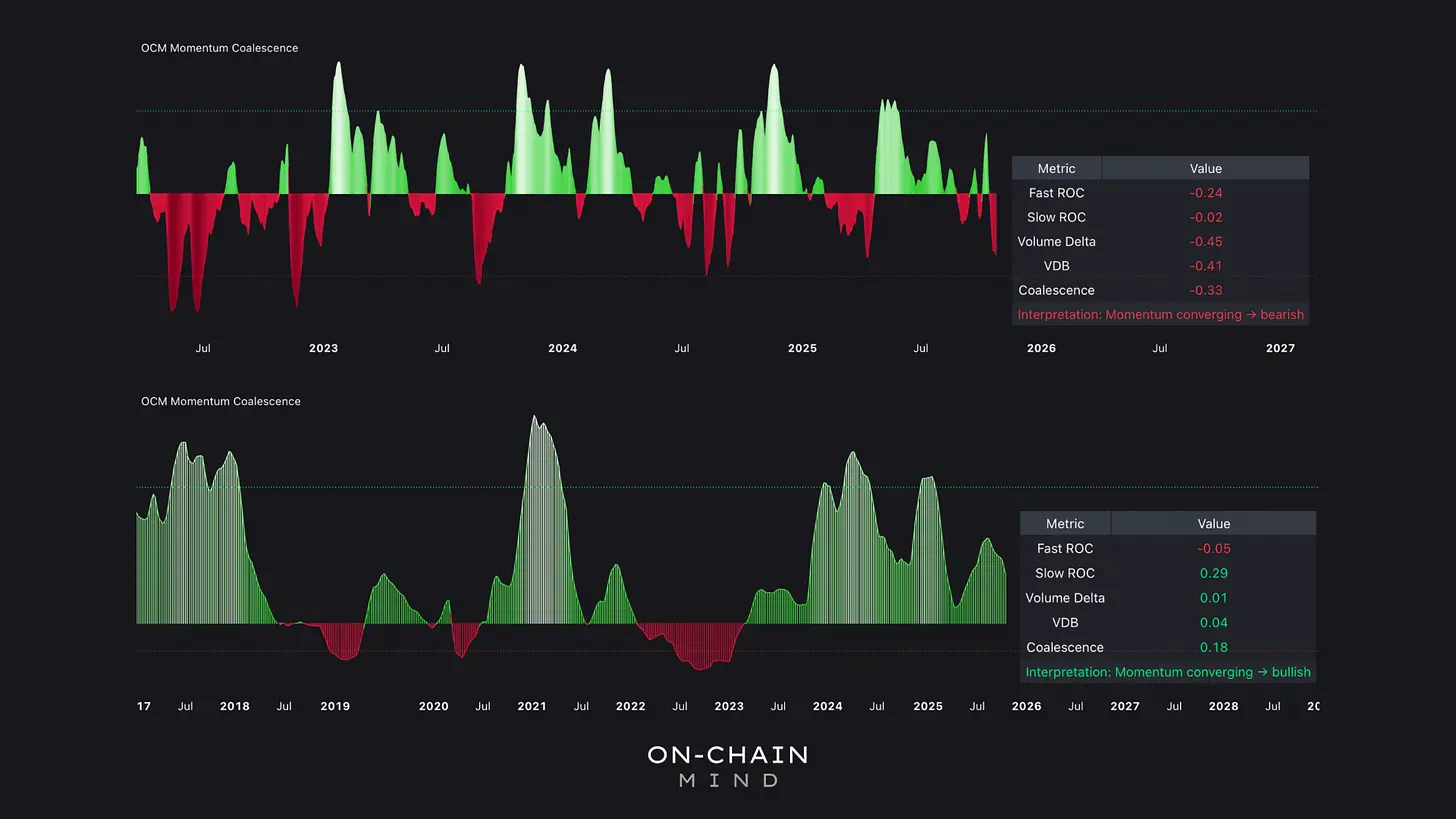
Market Snapshot: A 0.18 score shows consolidation, with short-term bearish pressure but bullish macro potential, priming for a breakout.
A New Way to Measure Momentum
As I preach time and time again, when it comes to technical and on-chain analysis, price is not the story. Beneath every rally and every crash, there are invisible forces at work — subtle shifts in momentum, volume, and volatility that most never see. That’s exactly why I’m introducing the Momentum Coalescence metric today.
This tool is built to measure the raw energy behind the market, showing when momentum is truly building, when bears are gathering, and when the market is simply pausing to catch its breath.
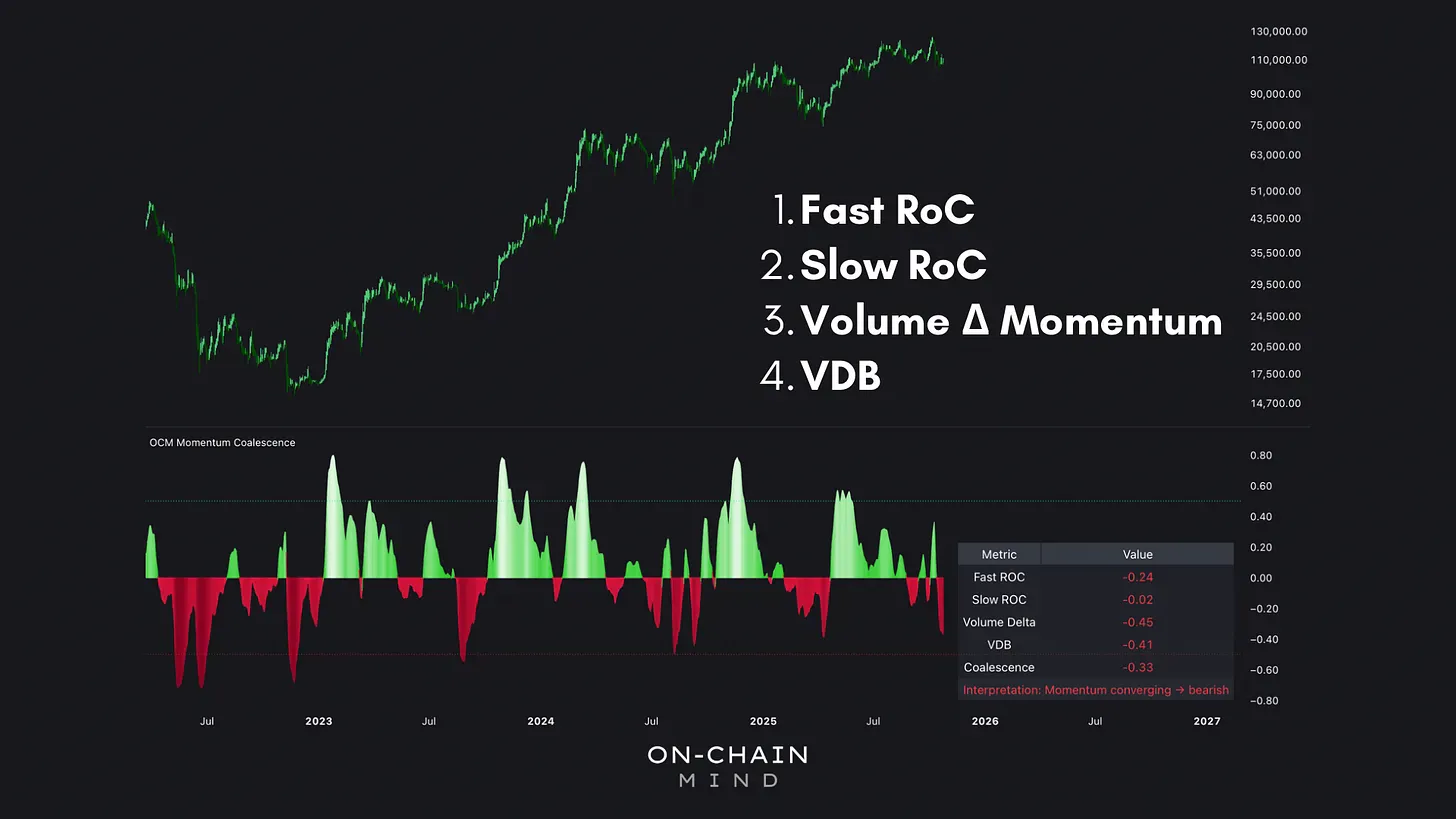
At its core, the metric is an oscillator designed to aggregate 4 distinct aspects of market behaviour. Here are its components:
Fast Rate of Change (Fast ROC) — measures short-term price momentum, providing an early signal of shifts in buying or selling pressure.
Slow Rate of Change (Slow ROC) — evaluates momentum over a longer horizon, capturing broader trends and reducing overreactions to short-term volatility.
Volume-Delta Momentum — tells you whether price moves are backed by genuine participation or just a handful of traders pushing the market. A rally without volume is a fragile one.
Volatility Directional Bias (VDB) — measures asymmetries in volatility and whether upward moves are more intense than downward moves (or vice versa). This shows you not just how volatile the market is, but which direction that volatility favours.
All 4 components are weighted, smoothed, and combined into the Coalescence Score. Check it out:
The Current Market Reading
Right now, the lower timeframes are signalling a clear bearish convergence. Momentum is stacking against the bulls, volume is thinning, and short-term volatility is skewing to the downside. On the surface, it looks like the market is losing steam, and in the short term, that’s exactly what’s happening.
But when we zoom out, the picture shifts. Higher timeframes still carry bullish undertones: momentum is holding, underlying trends remain intact, and the broader structure shows no signs of a full trend reversal.
To me, this suggests we’re likely seeing a corrective dip within an ongoing uptrend rather than the start of a larger bearish cycle. And this aligns quite nicely with my last piece on the big leverage shakeout. The market is catching its breath and pushing out those weaker hands — a subtle but healthy recalibration rather than a true breakdown.
Trading Applications: Extremes Deviations
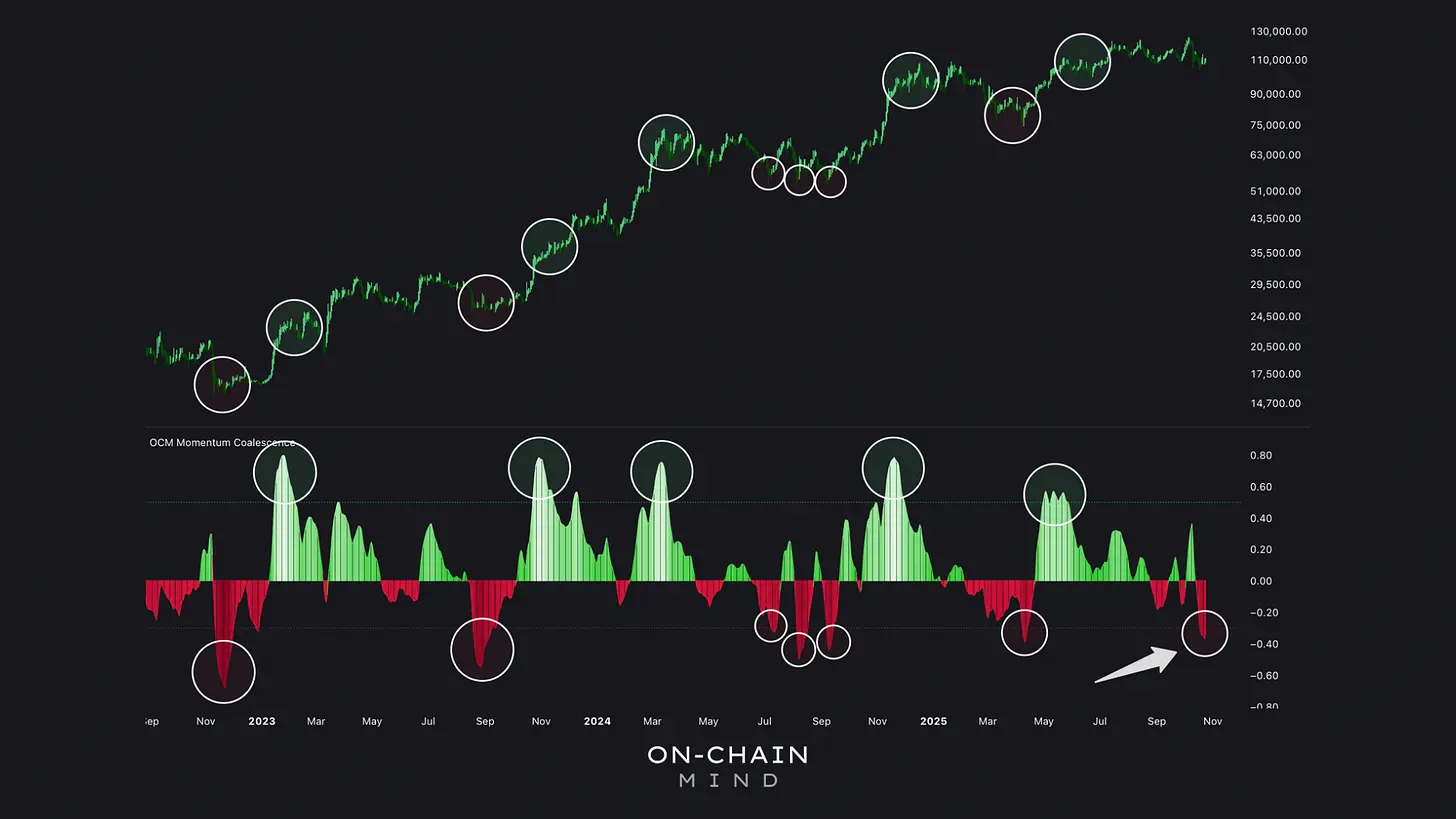
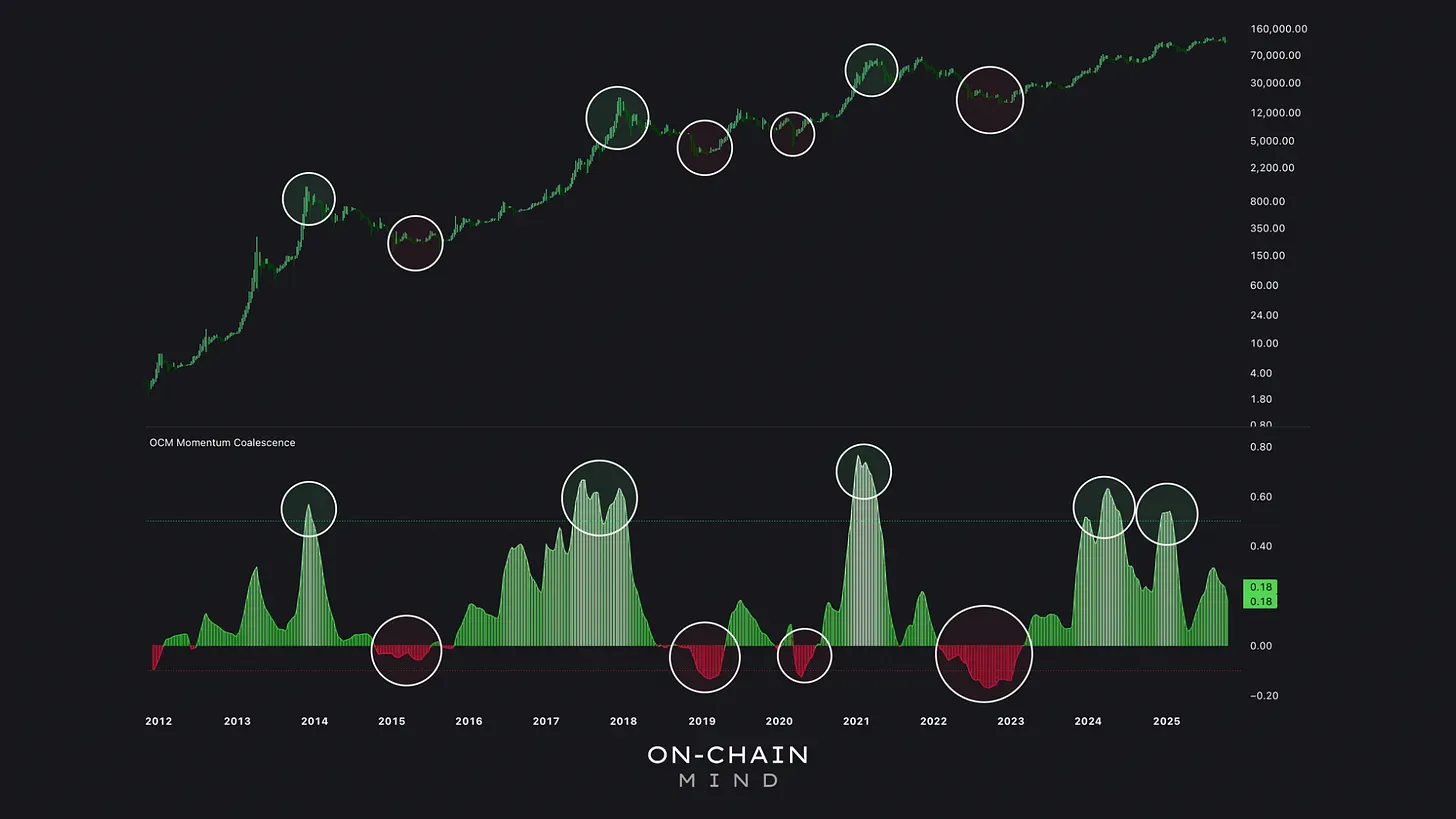
Historically, the largest negative deviations occur roughly once every 6 months, and these extremes often represent optimal contrarian entry points. While exact bottoms are impossible to predict, these readings highlight zones where bearish momentum is at its peak, offering high-probability opportunities.
Midline Crossings
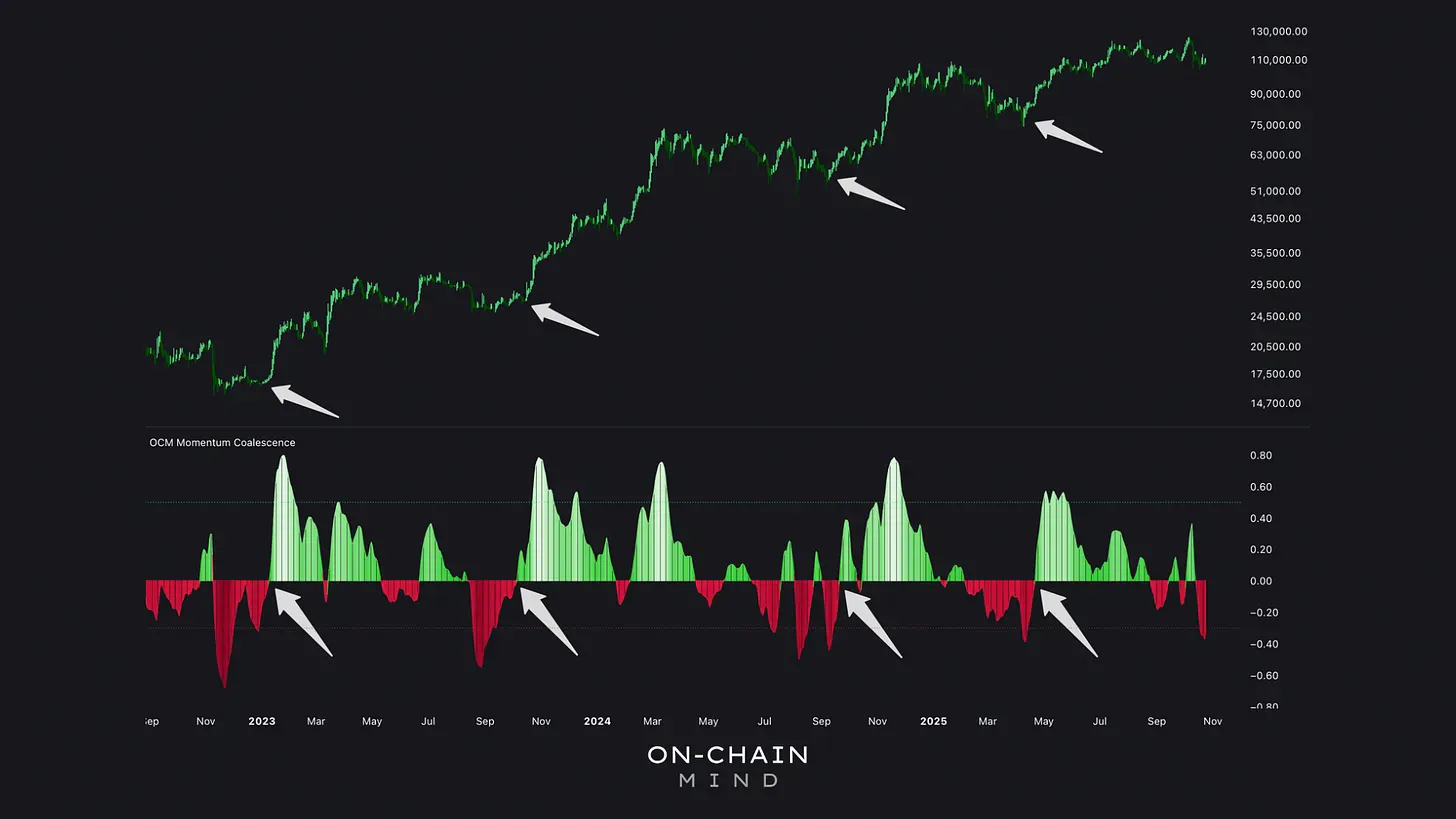
A slightly less aggressive approach involves monitoring when momentum crosses the oscillator’s midpoint. When momentum rises above this midline, it indicates accelerating market energy, while a fall below the midline suggests fading momentum and the need for caution.
Macro Cycle Tops & Bottoms
Beyond swing trading, the metric is invaluable for long-term macro cycle analysis. Readings above 0.5 often correlate with major cycle tops. While this metric doesn’t pinpoint exact tops, it acts as an early warning system. Conversely, deep red zones indicate decisive negative momentum, often highlighting long-term buying opportunities at discounted prices.
Bull/Bear Trend Identification
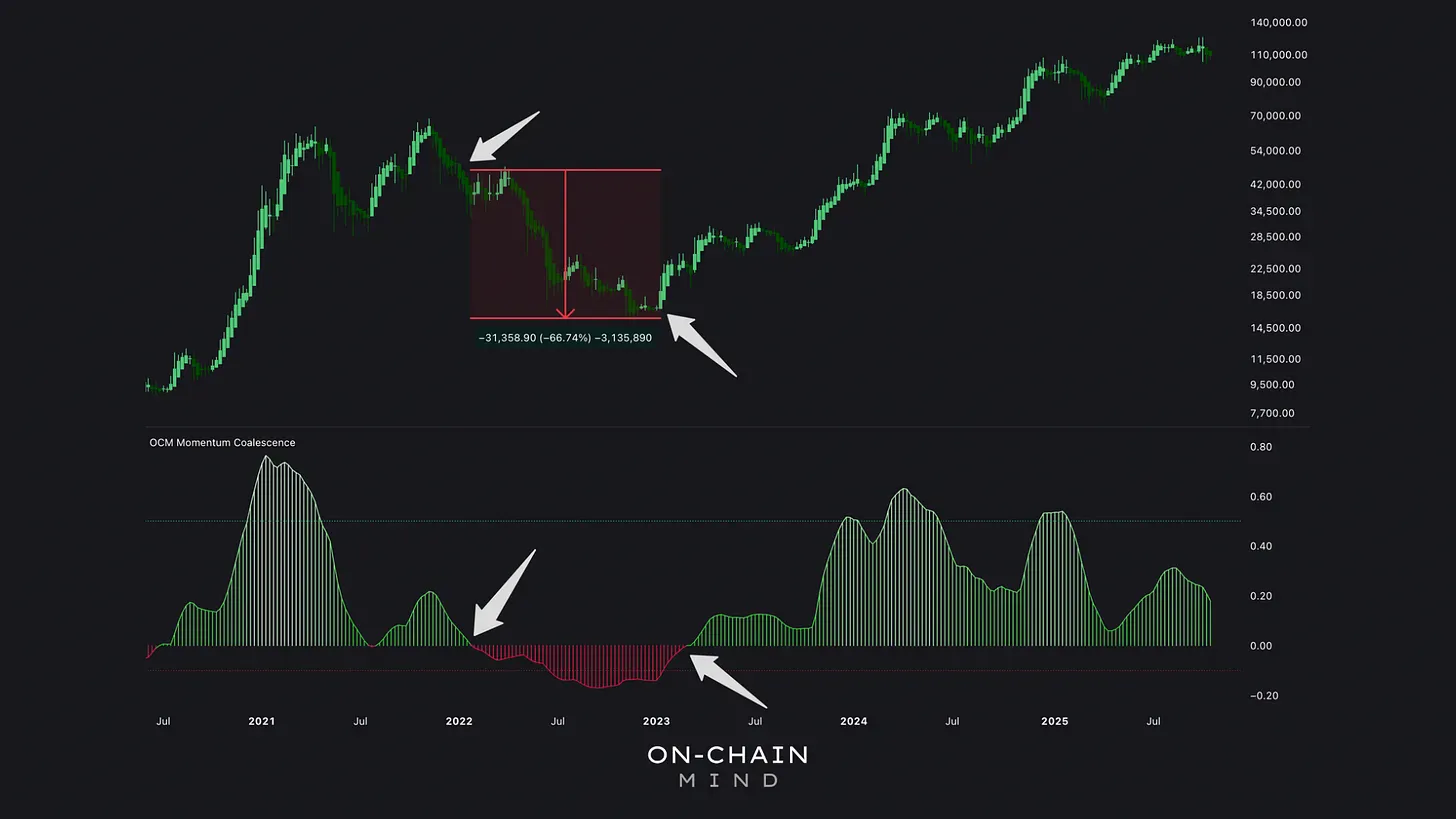
One of the most effective uses of the metric is identifying trends. Exiting when the metric turns red can protect capital during bear markets, while re-entering when it flips green signals the resumption of bullish momentum.
My Take on Momentum Coalescence
Join On-Chain Mind to read the rest of this analysis and get full access to Chart Studio.
- 200more words
- Premium Updatesevery update and monthly Q&A, in full
- Chart Studiofull access to every OCM chart and metric
- Weekly newslettersthe analysis in your inbox, no ads