In 2017, Bitcoin's average daily move was about $170. Last year it was about $1,500. In percentage terms, volatility actually halved, yet in dollar terms the swings grew 9 times bigger.
Both of those facts are true at the same time, and that is the whole problem.
Your brain does not feel percentages, it feels dollars, so an asset that has been calming down for years still feels like it is getting wilder. Meanwhile, over the past 3 years Bitcoin has been less volatile than Tesla on 8 days out of every 10, and nobody loses sleep over Tesla's chart.
This is exactly why the "too volatile" and "volatility is dying" camps keep talking past each other.
I think they are both half right, and the half they miss is where I get most interested, because volatility is the one thing that tells you when the market is boring and when it is about to get exciting.
Let's get into it.
Insights at a Glance
Fat Tails Hold the Returns: A few enormous days drive most volatility, and missing just 10 wipes out most of your gains.
Volatility Comes in Waves: Direction is unpredictable, but the size of moves clusters, so wild days tend to follow wild days.
Squeezed From the Top: Bitcoin's wildest periods have faded sharply while its calmest readings have barely moved in over a decade.
Calm Is a Warning: Quiet, coiled markets store energy, which signals a big move is coming, though never its direction.
Drizzle, Floods and Fat Tails
Before we can argue about whether Bitcoin is “too volatile” or “not volatile enough”, we need to be clear about what volatility actually is, because a lot of people quietly treat it as a synonym for risk. It is not. Volatility is simply the size of a typical daily move, nothing more and nothing less.
If you sort every day of Bitcoin's history by how far it moved, the picture is surprisingly gentle. The average day is up about 0.36%, which is that slow upward drift Bitcoin has shown over time. Hardly the stuff of nightmares.
So why does the headline volatility figure look so frightening? Because a tiny number of enormous days drag it upwards. The biggest 5% of days are responsible for around 60% of all the volatility in the market.

Imagine a town where it drizzles lightly on most days and then, every few years, a massive flood arrives. The average rainfall describes neither the gentle days nor the floods, and Bitcoin behaves in much the same way.
That is what traders mean by fat tails. Most financial models assume a bell curve, and on that curve a 5-sigma day, so 5 standard deviations from normal, should turn up roughly once every 4,800 years. Bitcoin's real distribution looks nothing like it. It is taller and thinner in the middle, which means the quiet days are quieter than the models expect, and then it keeps stretching out to the edges, where the bell curve says almost nothing should exist.
The wild days are far wilder.
But are those big days random? Not quite. Like turbulence on a flight, they come in patches: hit rough air and more is likely to follow, but once it is smooth, it tends to stay smooth for a while. Today's direction tells you almost nothing about tomorrow's, but the size of today's wave tells you a lot.
On an ordinary day there is about a 1-in-3 chance of a large move over the next 10 days. The day after a large move, that jumps to nearly 2 in 3.
Wild also tends to follow wild.
Compared to What?
Now let's tackle a favourite objection of the casual critic, that Bitcoin is “too volatile”. My reply is always the same: compared to what?
Against the S&P 500, fair enough. Bitcoin currently reads 37% annualised volatility to the index's 12%, so roughly 3 times higher. Although this was much worse when stretching back into history: in 2017 that gap was more than 10 times.
Against gold, the ultimate safe store of value, it is currently only about 1.6 times as volatile, down from around 8 times in 2018, partly because Bitcoin has calmed and partly because gold has heated up.
But the comparison that matters most is the one against the stocks people hold without a second thought.
Line Bitcoin up beside Nvidia, Meta and Tesla, three of the most familiar names in the market, and it is the calmest of the four. Throughout all of last year it was less volatile than Tesla on every single day, and over the past 3 years it has been less volatile than Tesla on 8 days out of every 10 and Nvidia on more than half.
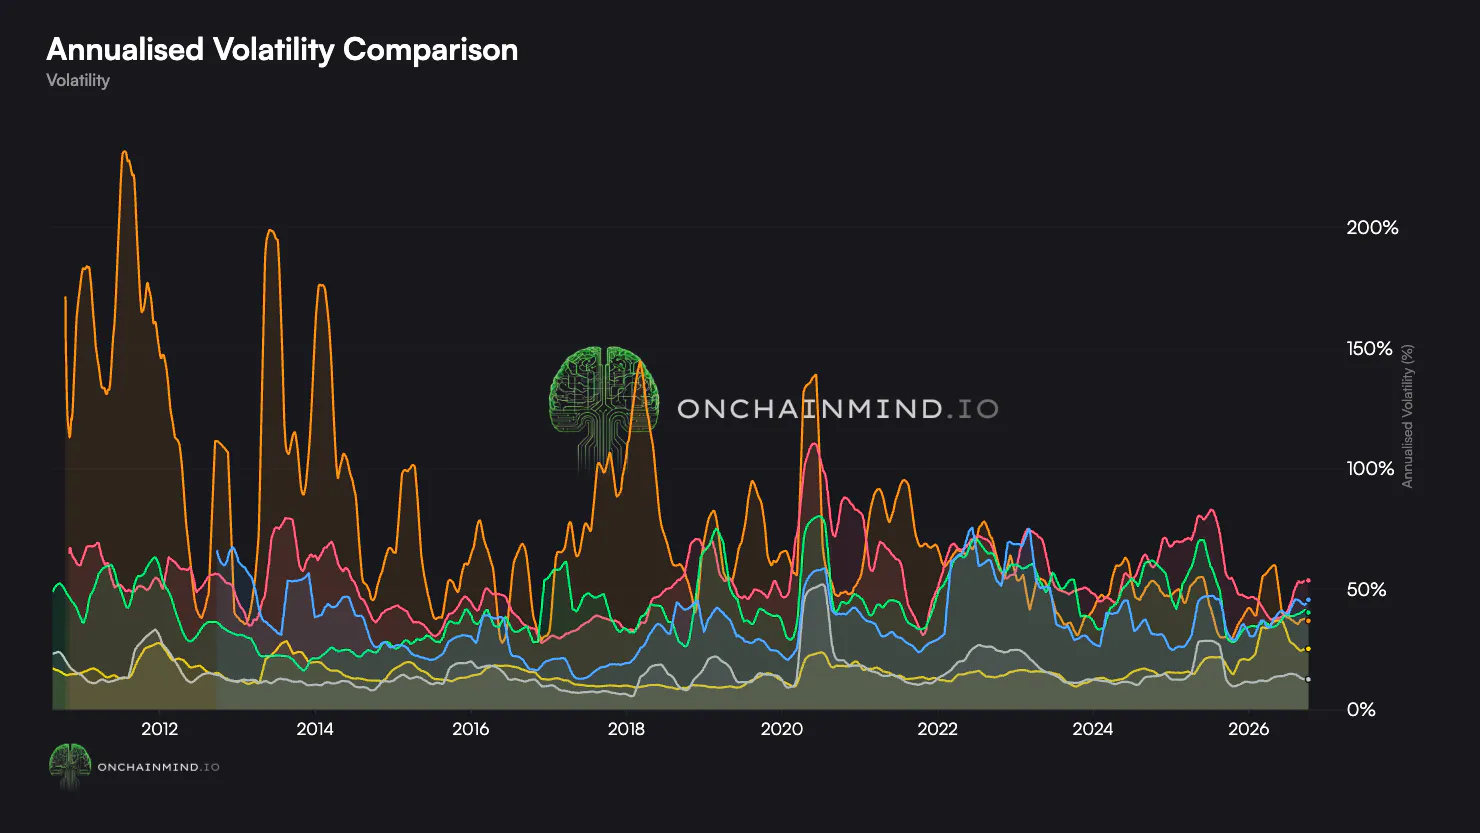
So why does it still feel so violent? Because your brain does not feel percentages, it feels dollars.
In 2017 Bitcoin's average daily move was about $170, while in 2025 it was about $1,500. In percentage terms volatility halved, yet in dollar terms the swings grew 9 times bigger. A $1,500 move in a day sounds like a disaster, even when it is a smaller fraction of the price than ever before.
Wall Street understands this perfectly, which is why companies like Nvidia and Tesla split their shares as the price climbs. A split simply chops each share into smaller pieces so the price drops back to something that feels comfortable, and nothing about the company changes. It just looks less expensive.
Berkshire Hathaway is the famous exception. Warren Buffett never split the original shares, so a single one now costs more than most houses, and on a quiet day it can move by several thousand dollars, more than Bitcoin's average daily move.
Yet nobody calls Berkshire wild. Bitcoin will never split either, so its moves will keep looking bigger in dollars even as it calms, and I suspect that perception gap will outlive the real one.
Squeezed From the Top
Now to the other side of the debate: is Bitcoin losing all its volatility?
Our new Realised Volatility view helps answer that. It shows each year's full range, from the calmest moment to the wildest, and the answer is more nuanced than either camp likes.
Look at the wildest readings first:
- 275% in 2013
- 206% in 2020
- 95% in 2022
- Just 71% last year
Now look at the calmest readings:
- 14% in 2016
- 17% in 2023
- 21% last year
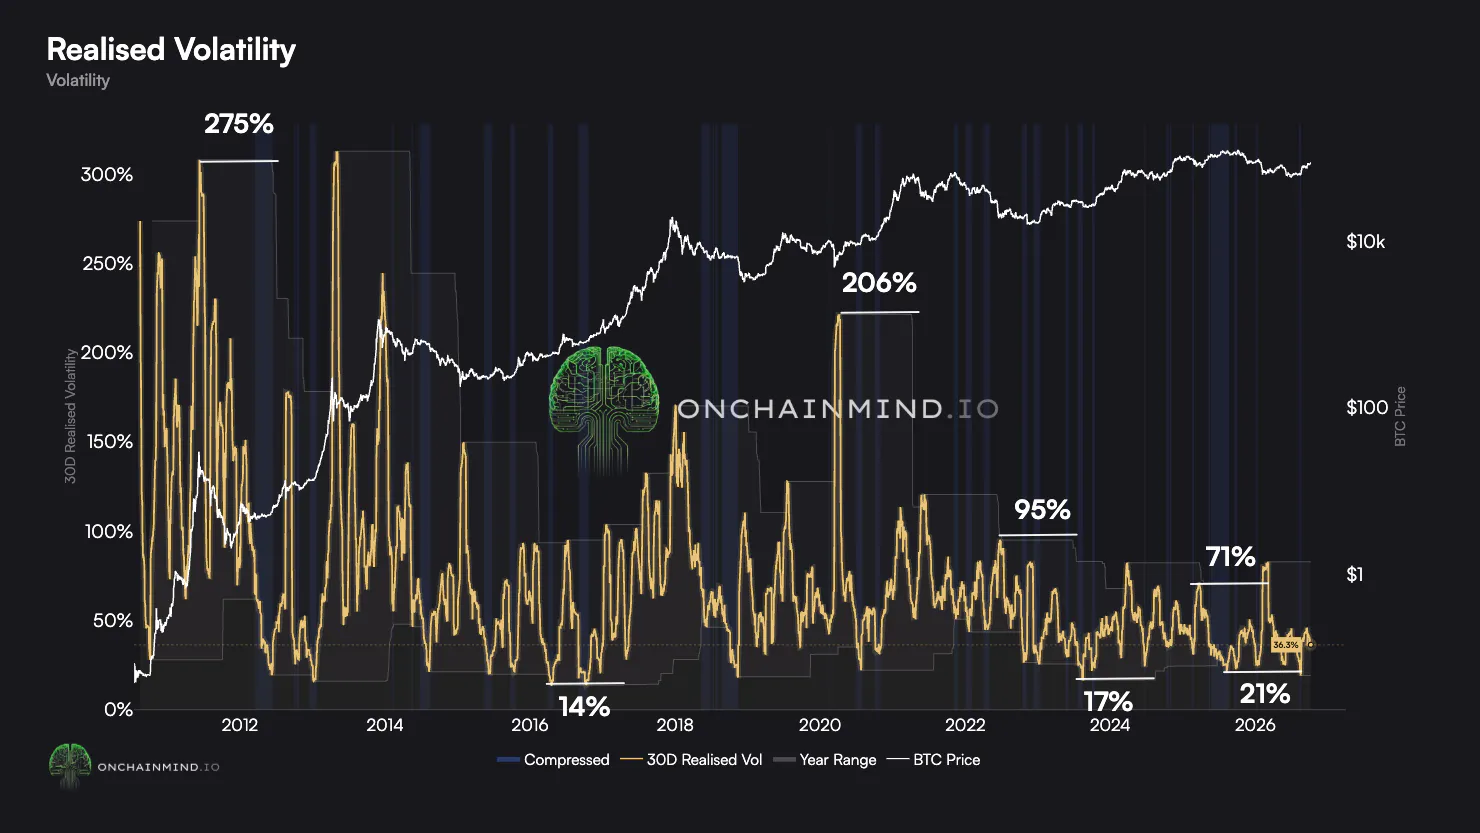
The top of the range has fallen by roughly three quarters, while the bottom has not fallen at all. If anything, it has crept up.
So the blanket claim that volatility has died does not survive contact with the data. Volatility is not dying, it is being squeezed from the top.
That creates a curious paradox: as the average gets calmer, the big moves become more shocking. The same shout that vanishes in a football stadium makes everyone jump in a library.
The shout has not changed, the room has.
Three Questions I Ask About Volatility
So how do you tell when boring is about to turn interesting? I ask 3 questions.
First, is the market unusually quiet?
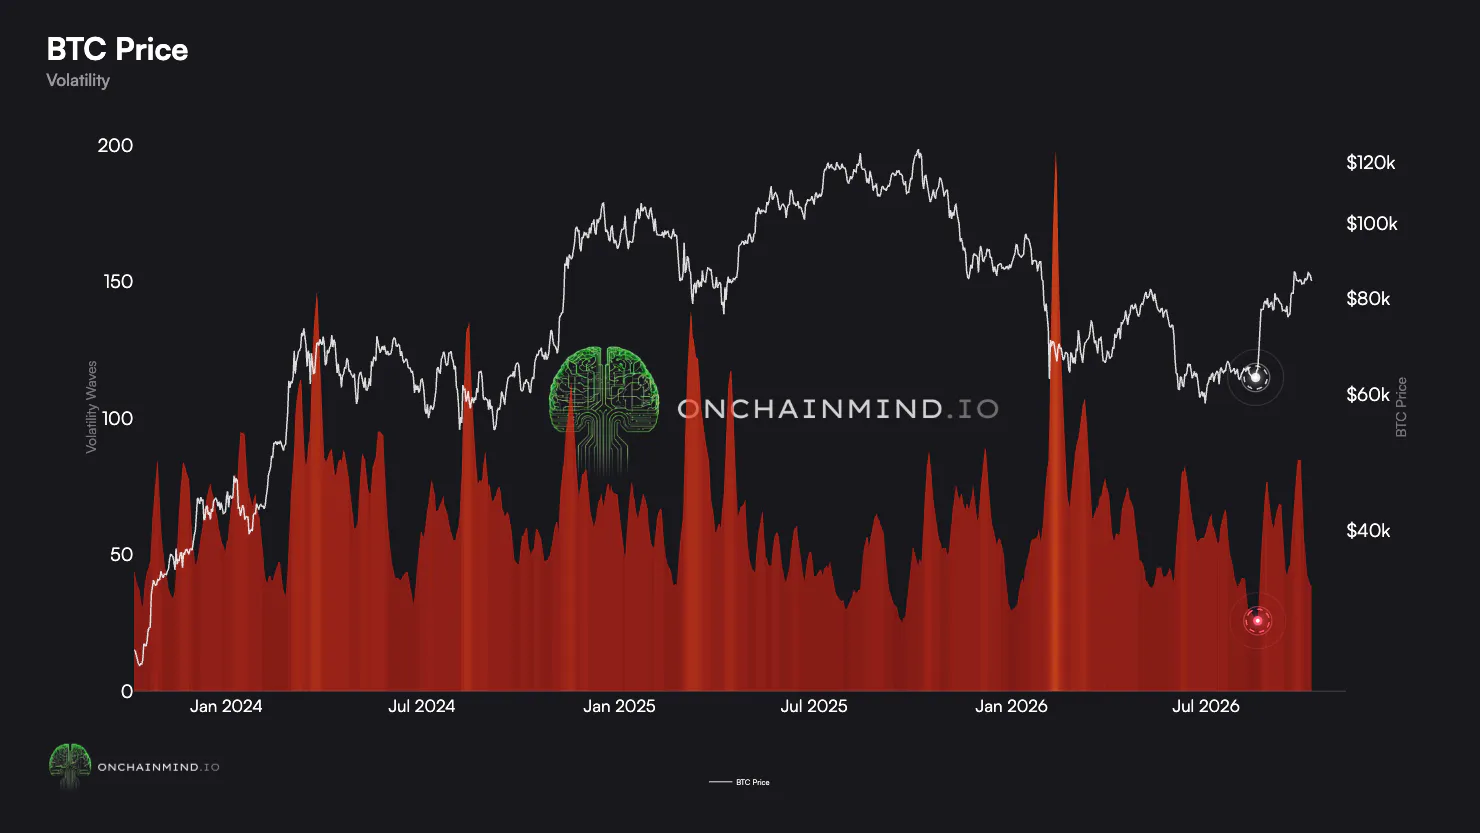
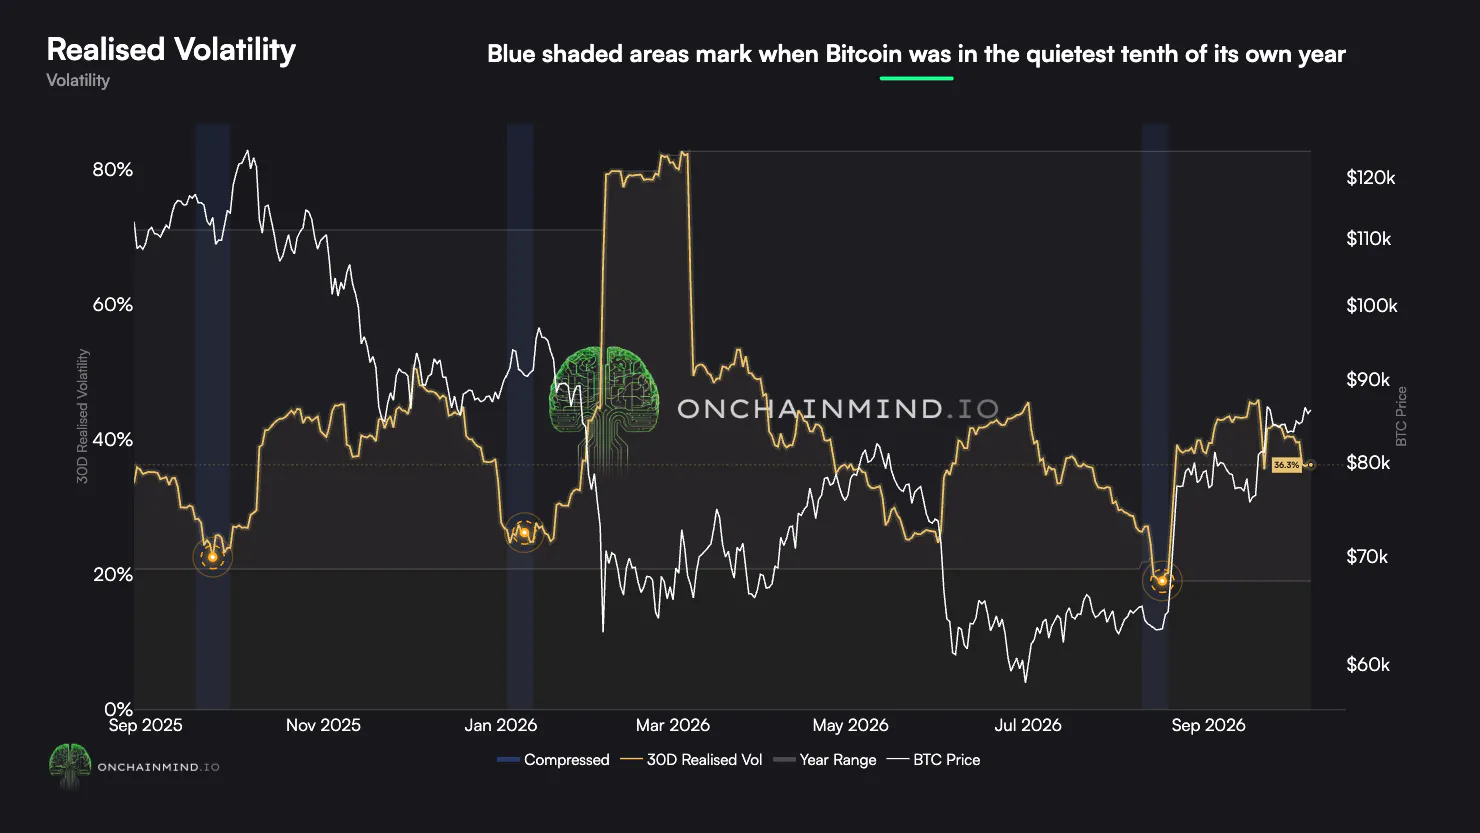
On the Realised Volatility view, the blue shaded areas mark when Bitcoin was in the quietest tenth of its own year. When readings get that compressed, volatility was higher 90 days later 81% of the time, against just 6% when the market was at the wild top end.
The quiet stretch that ended on 6th October last year was the exact moment of Bitcoin's all-time high, and within 3 months price was 32% lower. The one that ended in early January arrived just before the February crash, and the most recent was the one we flagged in August before our 37% rip higher.
These readings tell you travel is coming, just not which direction it’s heading.
Second, is price coiling?
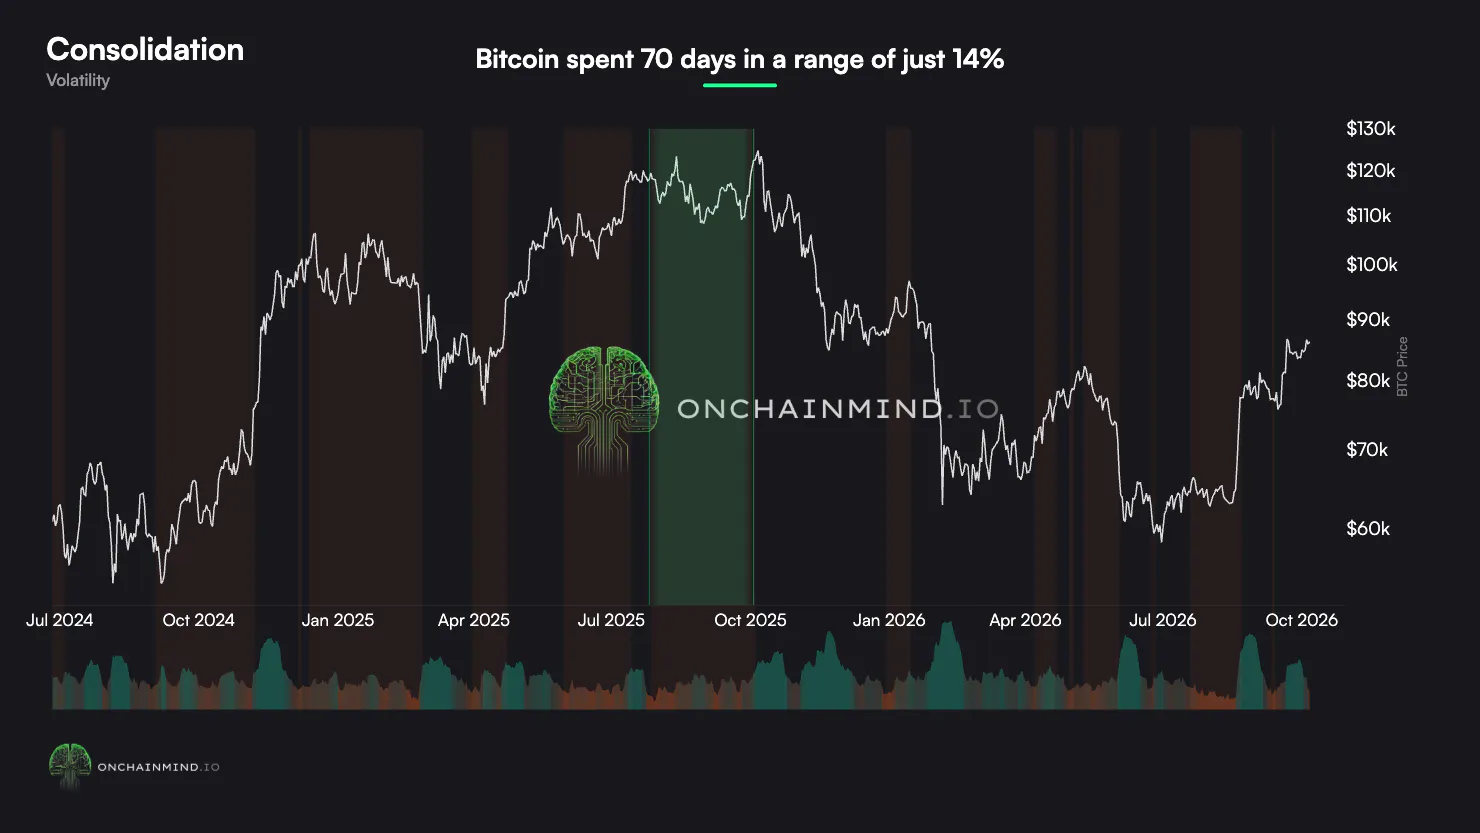
The Consolidation view looks at the same idea but from the price side. When price keeps bouncing around inside a tight range without going anywhere, the longer and tighter it gets, the more pressure builds.
From late July to early October 2025, Bitcoin spent about 70 days inside a range of just 14%, the tightest long consolidation in over 7 years, and it ended 2 days before the all-time high.
Third, is that energy actually going anywhere?
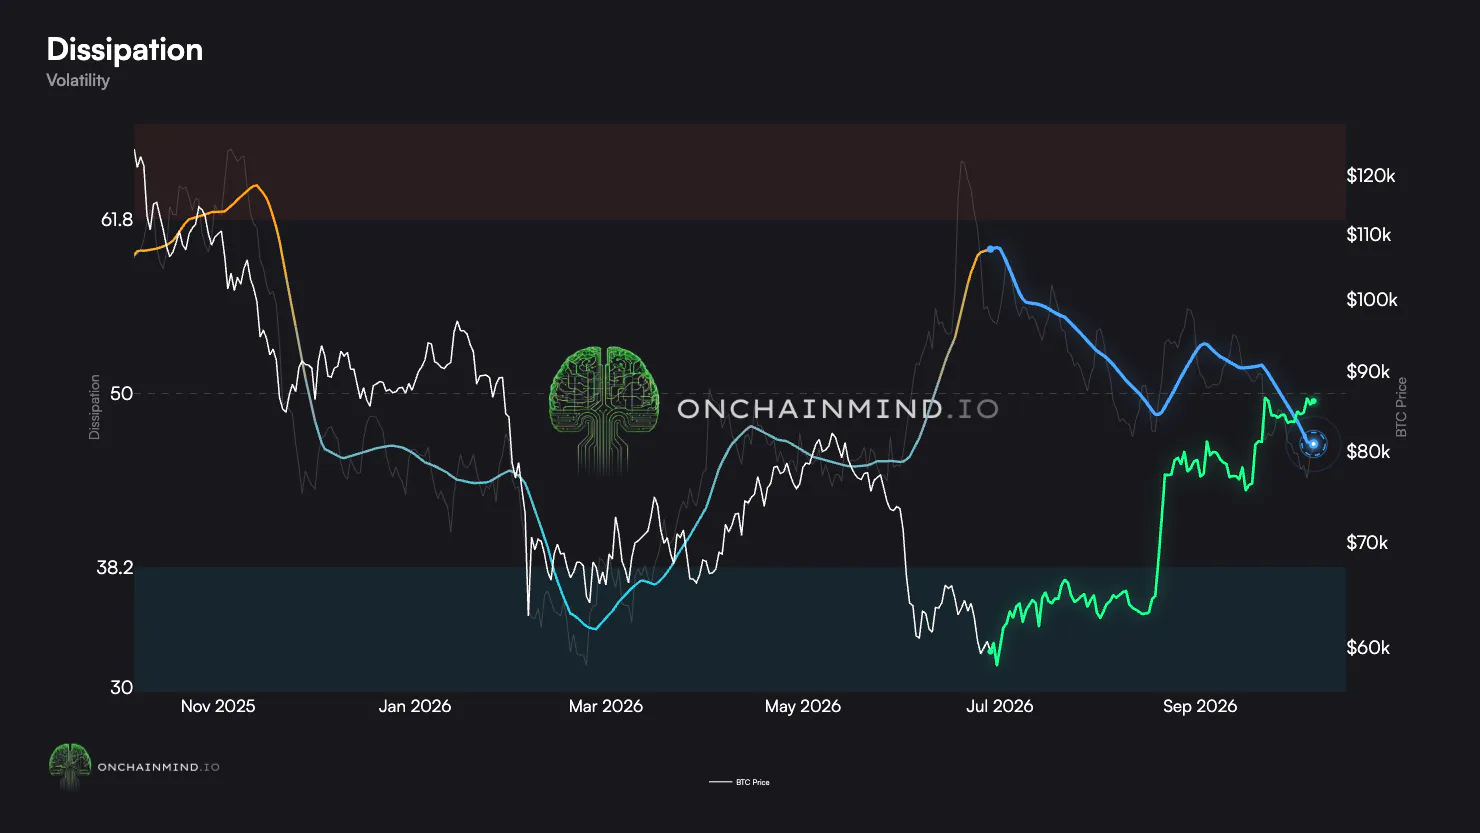
The Dissipation view answers this perfectly. When the line is high, the market is churning without getting anywhere, which is where potential energy builds. When it drops into the blue band, that energy is being released and price is moving with purpose. The market cycles between those 2 states.
Now apply that to this year. In July the line sat high, so Bitcoin was building up a serious amount of potential energy, and since then it has been falling as that energy is released.
Here is what catches my eye, though. Despite the huge rise since August, the line has not fully come down, and a move that large should have burned through far more. That suggests a good chunk of stored energy may still be sitting there with an unfinished trend, so it is one I am keeping a close eye on.
Why I See Volatility as a Clock
Volatility is not risk, it is a clock.
The mistake most people make is treating the quiet as safety and the noise as danger, when the returns actually live in a handful of enormous days. Hide from volatility and you hide from the days that pay for everything. The opportunity was never in avoiding it, but in knowing which state you are in.
What I love about this side of the market is how humble it is. Volatility rarely tells you the direction of travel, and I would be wary of anyone who says it does. But paired with the on-chain fundamentals, it becomes powerful: volatility tells you the energy state of the market, and the fundamentals tell you what holders are actually doing. Put the two together and the picture builds up beautifully.
It also settles the 2 objections we started with, and both deserve a partial pass:
- Is Bitcoin too volatile? Not by the standards we apply to the stocks people already own. It is calmer than many of the blue chip stocks that millions of people hold without losing a second of sleep, yet it is still the one wearing the label.
- Is volatility dying? The extreme spikes are fading, but the baseline underneath them is not. I think that is the best of both worlds. A calmer Bitcoin is far easier for cautious and institutional money to hold, while the handful of enormous days that create the returns are still there.
Volatility will never tell you which way, but it will tell you when. So the next time everyone calls Bitcoin boring, take that as your cue to start paying attention.
I'll catch you in the next one.
Cheers,