
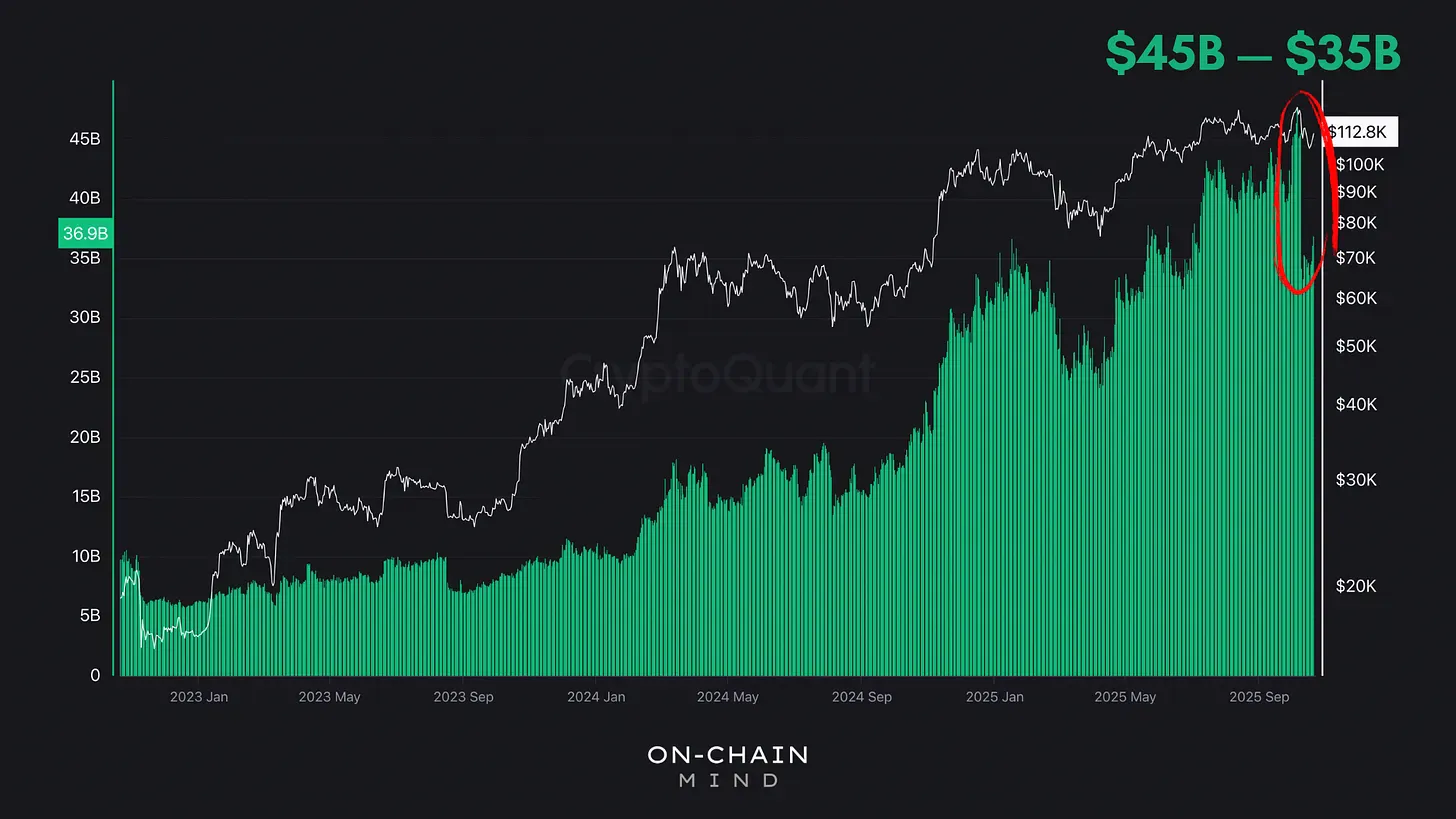
Recently, the Bitcoin market saw a dramatic event: over $10 billion in futures positions evaporated in just 24 hours. Some are calling it the “final capitulation” before the next bear market, but from my perspective, it actually looks like a classic structural reset.
In this article, we’ll break down how the flush unfolded, why it likely doesn’t signal the end of the bull market, and how you can interpret the key on-chain and derivative metrics to navigate this accumulation opportunity.
Insights at a Glance
A Forced Deleveraging: Open Interest fell 22% in a day, far outpacing Bitcoin’s 13% price drop. This indicates liquidations, not mass spot-market selling.
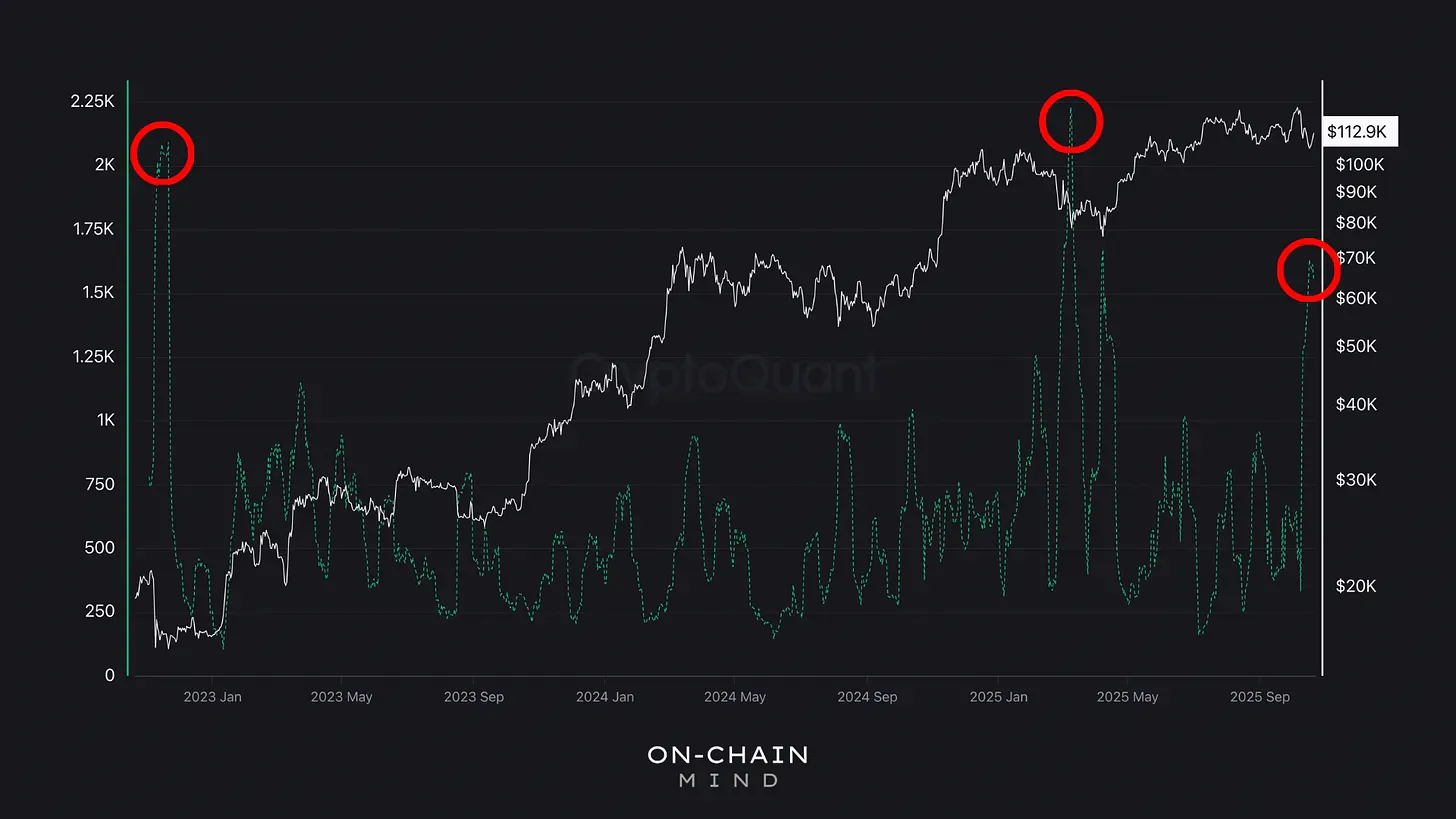
Liquidation Spikes Signals Structural Lows: The 3rd largest long liquidation in 3 years has marked a potential turning point.
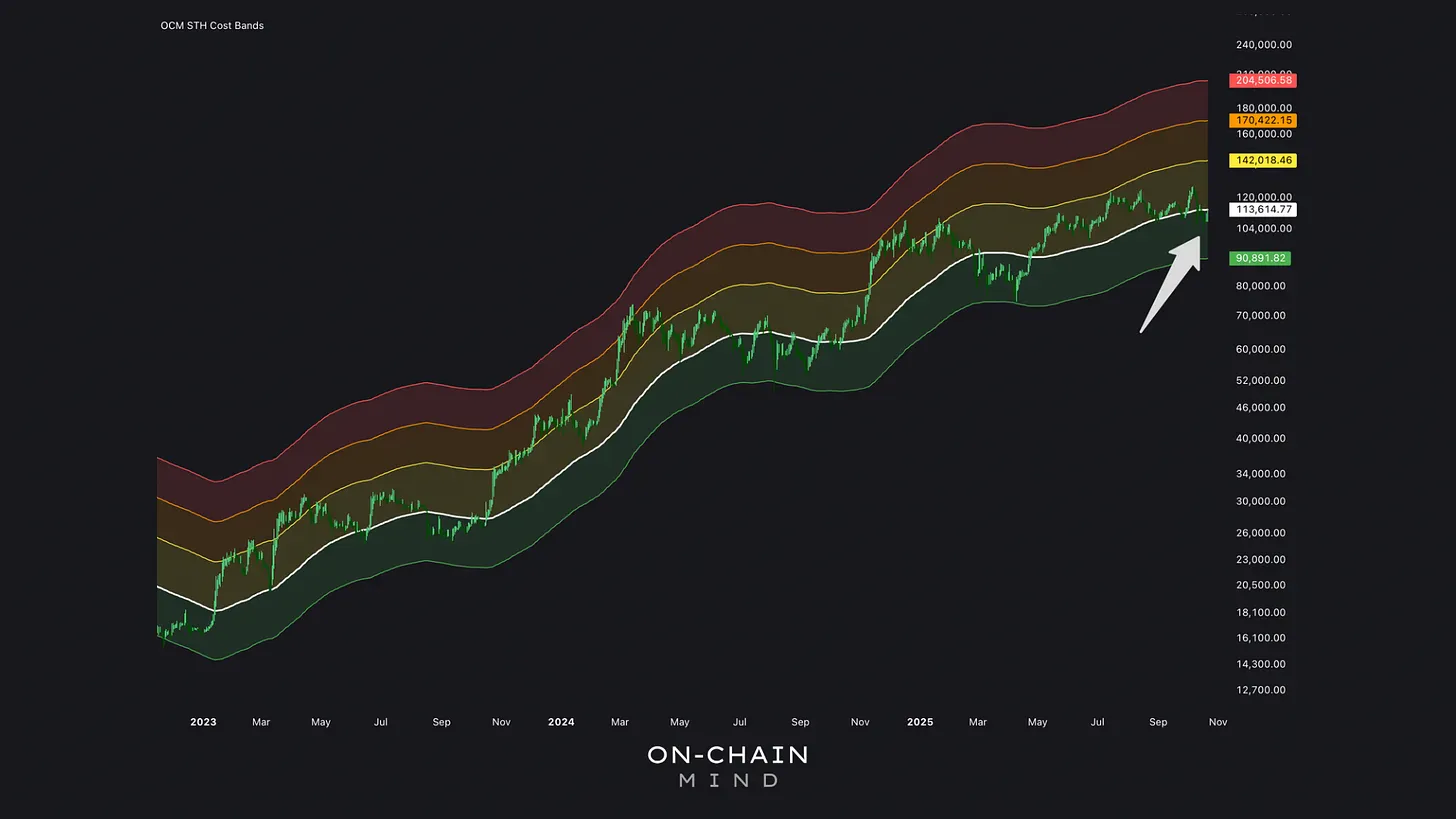
On-Chain Support Holds: Bitcoin remains above the short-term holder cost basis (~$113,000), maintaining my bullish framework.
Risk Metric Reset: The Short-Term Risk Score dropped from 47% to 38%, creating accumulation-friendly conditions.
A Flush, Not a Freefall
The recent collapse in Bitcoin futures open interest was staggering. From roughly $45 billion to $35 billion in a single day — a 22% contraction. Meanwhile, Bitcoin’s price fell from around $124,000 to $107,000 — a 13% decline.
That difference is crucial. Open interest fell nearly 62% more sharply than price, a clear sign that derivatives markets (not spot holders) were driving the move. Margin calls, cascading liquidations, and forced deleveraging swept through both long and short positions, leaving spot investors largely intact.
This is a classic market detox. In bull cycles, open interest naturally inflates as traders pile in with leverage. Volatility spikes trigger violent unwind events, which are painful in the moment, but healthy in the long run. Once the smoke clears, the market is left with cleaner positioning, fewer over-leveraged traders, and a healthier structural foundation.
Liquidation as a Signal
Looking deeper, this was the 3rd largest long liquidation in 3 years. The previous 2 coincided with major cyclical turning points:
The absolute capitulation bottom of the prior bear market.
The retracement to around $80k after Bitcoin’s initial surge to $100k.
In each case, liquidation spiked dramatically, then began tapering, signalling that the worst of the forced selling had passed. But what usually happens next? Well normally, the market stabilises and resumes its uptrend.
A long squeeze works like this: traders with too much leverage on the upside are forced to sell as prices fall, pushing the market down temporarily. Once the over-leveraged positions have been cleared, the market stabilises. Historically, these moments mark structural lows, not the end of cycles.
Market Structure Through Futures
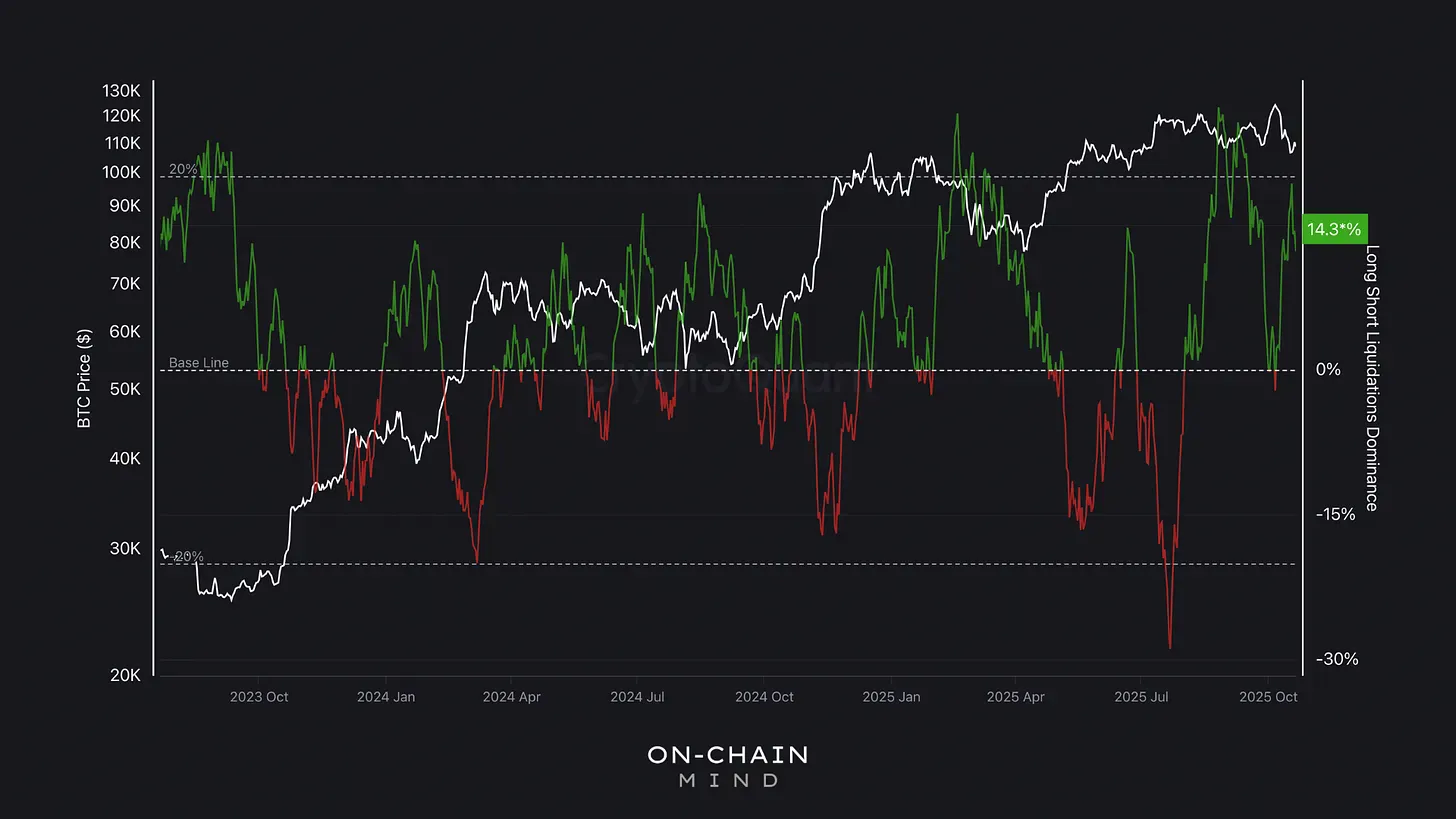
One of the clearest ways to understand what just happened is by looking at the Futures Long-Short Liquidation Dominance chart. This simple tool shows whether longs or shorts are being wiped out more heavily.
Historically, heavy long liquidations act as a contrarian signal: when over-leveraged longs are forced out, it usually marks the point at which buying opportunities emerge. Conversely, if shorts are being squeezed, the market is overextended, and chasing moves becomes risky.
Right now, the chart is solidly in the green zone, indicating that long positions have been heavily flushed. This aligns perfectly with the view of a structural reset. Speculative excess has been purged, positioning is cleaner, and opportunity is quietly returning to the market.
On-Chain Support
Beyond derivatives, on-chain structure provides crucial context. Bitcoin’s price is currently hovering around the short-term holder cost basis at roughly $113,000. This level represents the average acquisition price for coins held less than 155 days, representing the most recent buyers, often the most reactive cohort.
This is one of the most important support zones in a bull market. As long as the price remains above this white line, the ongoing bull thesis holds firm. Breaching it and testing it as resistance would signal that short-term holders are under pressure and market dynamics are shifting.
But for now, the support is intact, meaning that despite the large futures flush, the underlying market structure remains robust.
Measuring Risk in a Resetting Market
One of my favourite tools to navigate these periods is the Short-Term Risk Score, which quantifies near-term speculative risk by blending multiple indicators into a single composite measure. It combines factors like:
Join On-Chain Mind to read the rest of this analysis and get full access to Chart Studio.
- 1more chart
- 450more words
- 1more section
- Premium Updatesevery update and monthly Q&A, in full
- Chart Studiofull access to every OCM chart and metric
- Weekly newslettersthe analysis in your inbox, no ads