Buy fear, sell greed is the most repeated rule in investing, so I tested 324 different ways of applying it to Bitcoin. Only 17 beat simply holding on a risk-adjusted basis, roughly 1 in 20.
The Fear and Greed Index isn’t the problem. The way almost everyone uses it is.
Hidden inside it is a signal that returned 51% a year with a worst fall of just -28%, and run at 2x it turned $10,000 into over $2.1M with a much smaller drawdown than buy and hold.
Here is what the 44,000 backtests showed, why the contrarian trade breaks down, and the stress tests I ran to try to break the model.
Let’s get into it.
Insights at a Glance
- The Contrarian Trap: Only 17 of 324 buy-fear, sell-greed variants beat simply holding on a risk-adjusted basis.
- Fear Is a Regime: Extreme fear readings were followed by worse 90-day returns, not better ones, across the data.
- The Sentiment Regime: Two simple legs produced 51.9% a year with a -28% worst fall, versus -77% for holding.
- Leverage, Used Tactically: At 2x, the strategy reached $2.11 million with a -43% drawdown and better risk-adjusted returns.
The Rule Everyone Knows
“Be fearful when others are greedy, and greedy when others are fearful”
This Warren Buffett mantra is probably the most repeated line in investing. And for good reason. At its heart, it's a line about human nature. Crowds tend to overreact in both directions, and the best opportunities often show up exactly when acting on them feels most uncomfortable.
It's easy to agree with on paper, and far harder to follow when everyone around you is panicking or celebrating.
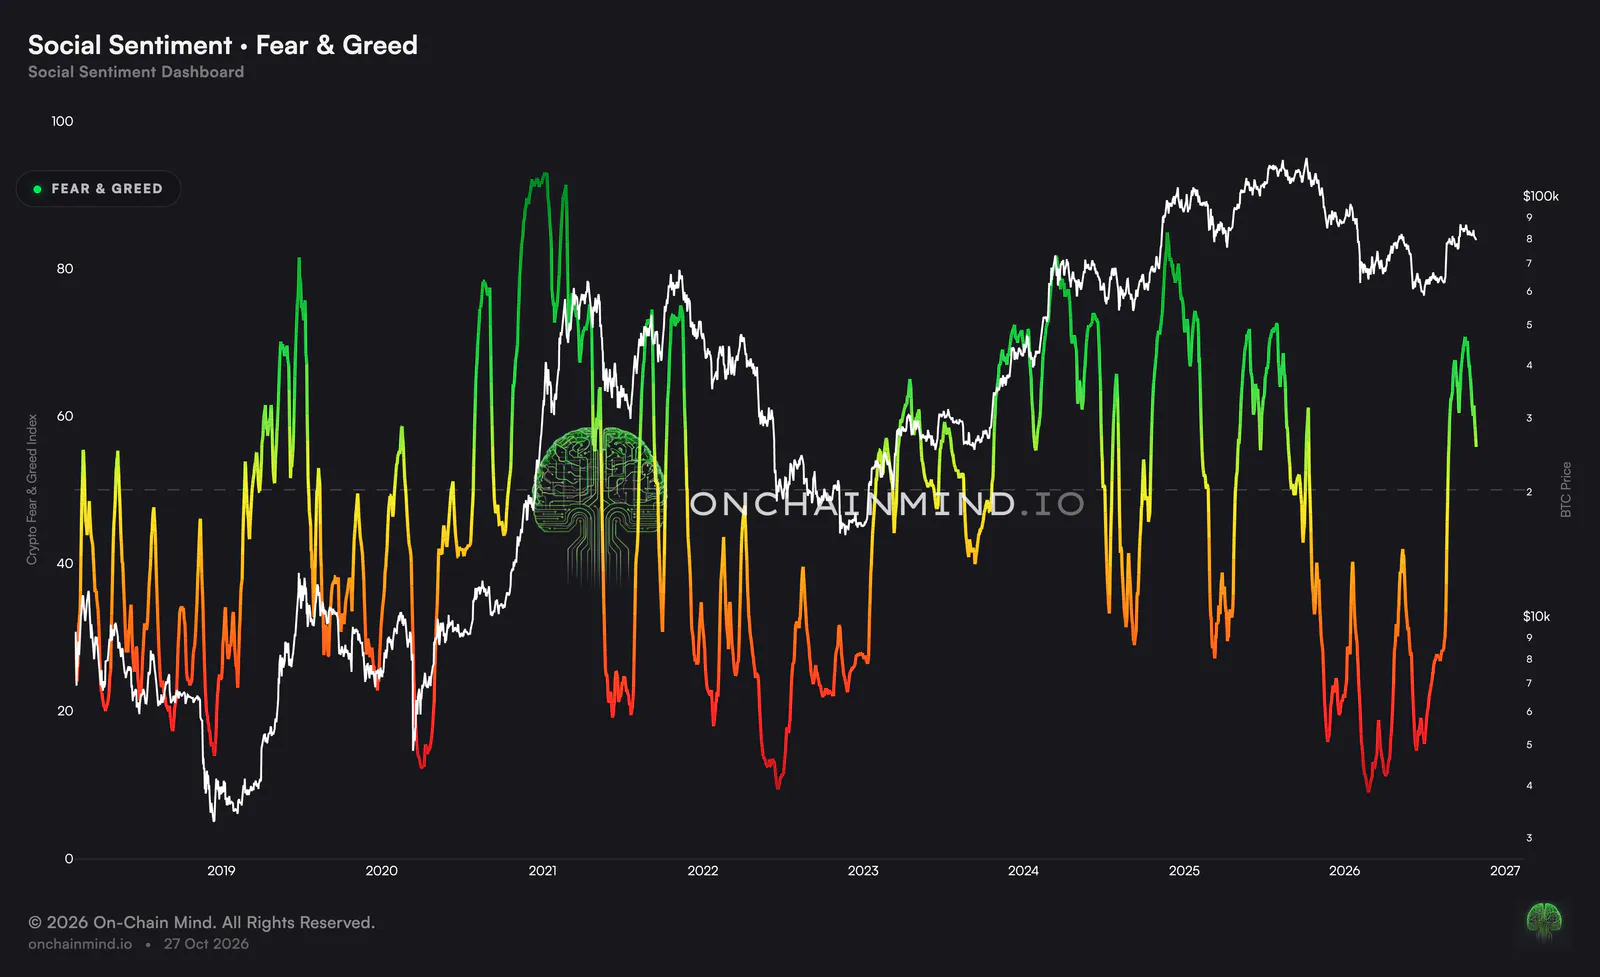
The Fear and Greed Index is an attempt to put a number on that crowd mood. It's a single daily reading from 0 to 100, where low numbers point to fear and high numbers point to greed. It blends:
- Price volatility
- Momentum
- Volume
- Social media activity & sentiment
- Bitcoin dominance
- Search trends
I rate it as a measure. Because it rolls a confluence of readings into one, no single input can hijack the whole thing on its own.
But measuring sentiment well and being tradeable are two very different things. To find out whether it actually works as a trading signal, I first needed something fair to compare it against.
Why the Contrarian Trade Breaks
The benchmarks come first.
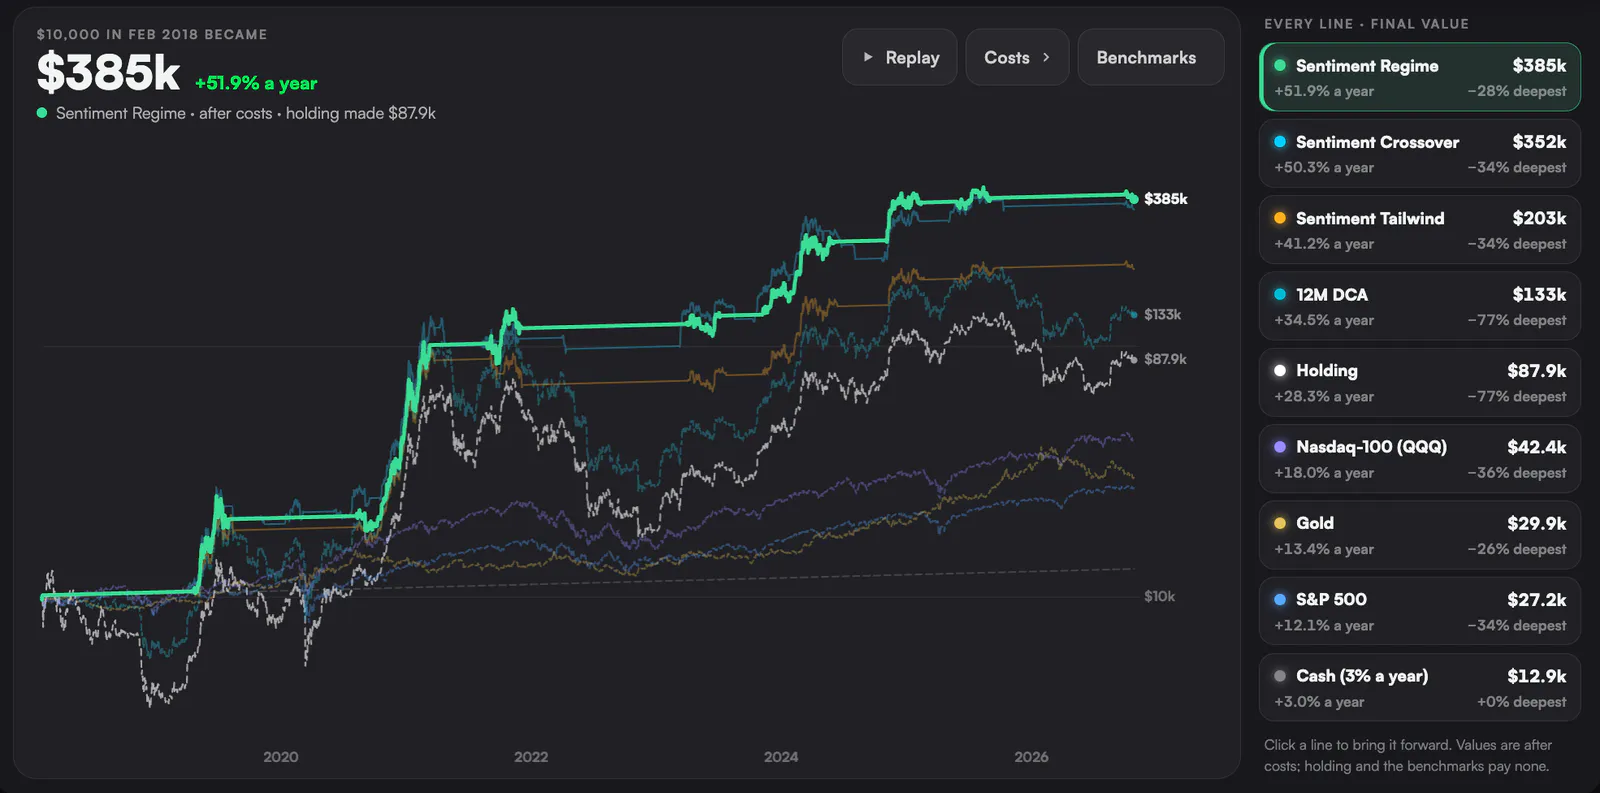
- B&H: Since the data began in February 2018, simply buying and holding turned $10,000 into about $87,000, roughly 28% compounded a year. That's a strong result, but it came at a cost. Along the way, it fell 77% from its peak, the kind of drop that shakes most people out of the market entirely.
- DCA: A weekly dollar-cost average, buying a fixed amount at regular intervals, had the same drawdown as B&H but did slightly better at about $132,000, or 34% a year. That's largely down to timing. February 2018 was a rough moment to drop in a lump sum, with the market still unwinding from the late 2017 mania, so spreading purchases out meant picking up more of the position at lower prices.
The measure I keep coming back to when studying strategies is return per drop, which is annual return divided by the worst fall.
Put simply, it tells you how much return you earned for every unit of pain you sat through. A strategy that makes big gains but nearly wipes you out on the way isn't much use if you can't stomach holding it.
With those benchmarks in place, I tested 324 variants of buying fear and selling greed. Each one buys when the index drops below a chosen level and sells when it climbs above another. I ran them across both the raw index and smoothed versions, which average out some of the daily noise, and across every sensible pair of thresholds.
The best of them smoothed the index slightly, bought below 15, sold above 80, and made 48% a year.
On the surface, that comfortably beats both benchmarks. That looks impressive until you see its worst fall of about -54%. Less painful than holding, yes, but still a drop that would test anyone's nerve.
The most surprising fact however is that only 17 of the 324 beat holding on return per drop. That's roughly 1 in 20. In other words, if you'd picked a version of this strategy at random, the odds were heavily stacked against you doing better than simply sitting on your hands.
And the purest form of the idea, holding only during fear and sitting in cash during greed, lost 5.8% a year while Bitcoin went up almost 9 times.
The philosophy behind Buffett's line may well be sound, but followed literally on this index, it would have incurred some serious opportunity cost.
Sentiment Is a Regime, Not a Pendulum
So why does the textbook trade fail so badly?
Let's start with the numbers. Take every day the index read 25 or lower, and look at what Bitcoin did over the following 90 days. The median outcome was a fall of 4.3%. Now compare that with every day in the dataset, whatever the mood. Across all of them, the median 90-day return was a gain of 3.3%.
In other words, extreme fear has been followed by worse returns, not better ones. Buying when the index was flashing fear didn't hand you an edge. It actually left you trailing the market.
The reason is that fear in Bitcoin isn't a compressed spring waiting to snap back. Very often it's the opening act of something that gets worse. In both 2018 and 2022 the index sat in fear for months while price kept grinding lower. If you had bought every fearful reading along the way, you would have been catching the same falling knife over and over again.
To see why this happens, it helps to look at what the index actually contains. Half of its inputs are price, volatility and volume, so it is largely a momentum measure in disguise. When you read it, you are mostly reading what price has just been doing, rather than anything that tells you what comes next.
That matters, because Bitcoin is a momentum asset. Its trends tend to feed on themselves. Greed tends to persist, and that is the environment the big trending moves happen in. Fear persists too, and that is the environment of long bear markets. So a reading of extreme fear is less a sign that the selling is exhausted, and more a sign that the downtrend is still in charge.
So the better question isn't how scared people are. It's what mood we are in, and whether that mood is getting better or worse.
The Sentiment Regime
Rather than testing a handful of ideas and picking the one I liked most, I wanted the data to make the choice. So I had our Strategy Lab at On-Chain Mind run about 44,000 rules on this index, covering levels, crossovers, the momentum of averages, caps on extreme greed, price filters and second conditions.
When you test that many variations, you can see which ideas keep holding up and which only looked good once. One family consistently came out on top, and I've called the best strategy from that family the Sentiment Regime.
The idea is simple.
It runs two tests, each answering a different question:
- The first uses a slow line and asks whether the market's mood has broadly been neutral or better. A few scary days don't shift it, so you stay in a healthy market while everyone else panics over nothing (much like this week).
- The second uses a quicker line and asks whether that mood is still improving.
You hold Bitcoin only when both agree. If either fails, you move to cash. The slow line stops you being shaken out by noise, and the quick line stops you riding a turn all the way down.
So how did it perform? Even after fees and slippage, it made 51.9% a year with a worst fall of -28%. In real money, $10,000 became about $385,000, against $87,000 from holding and $133,000 from DCA.
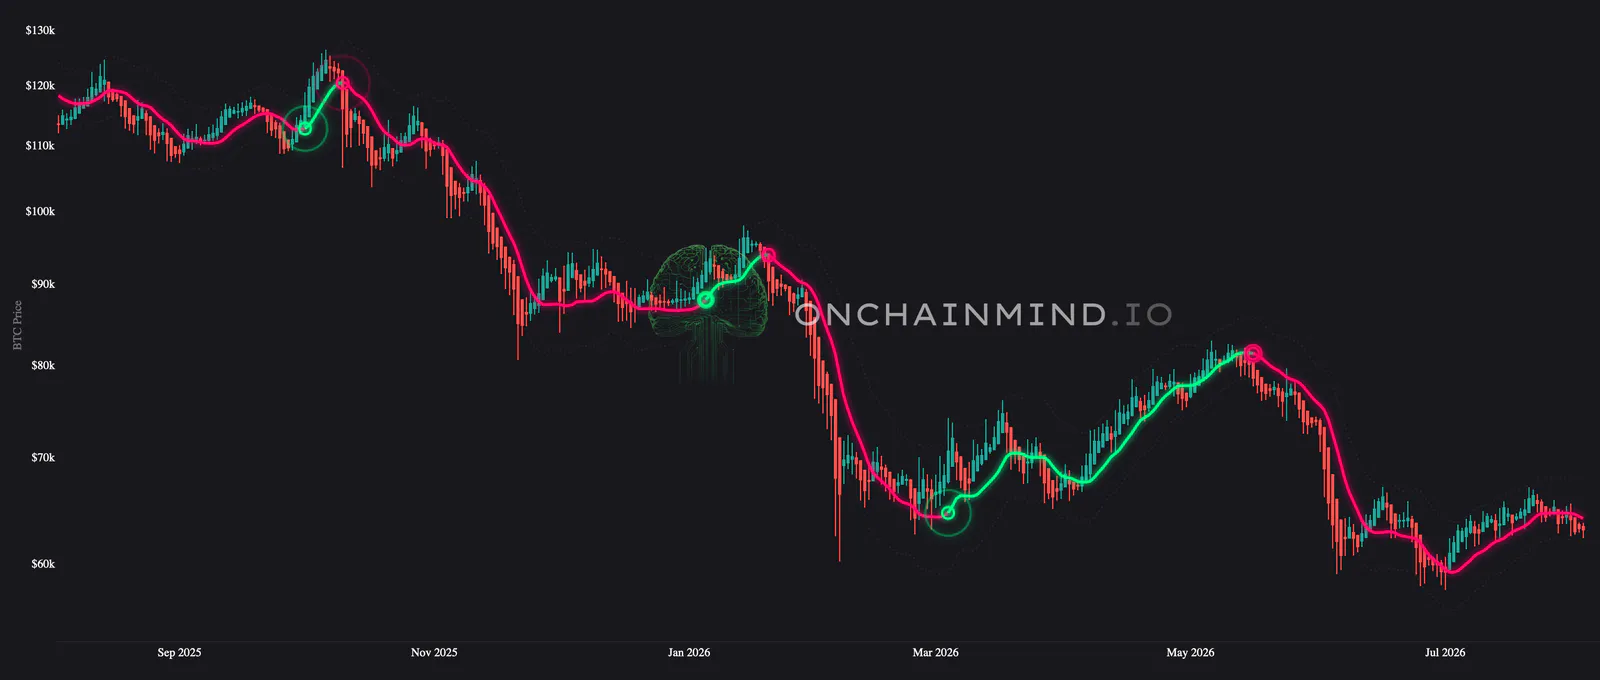
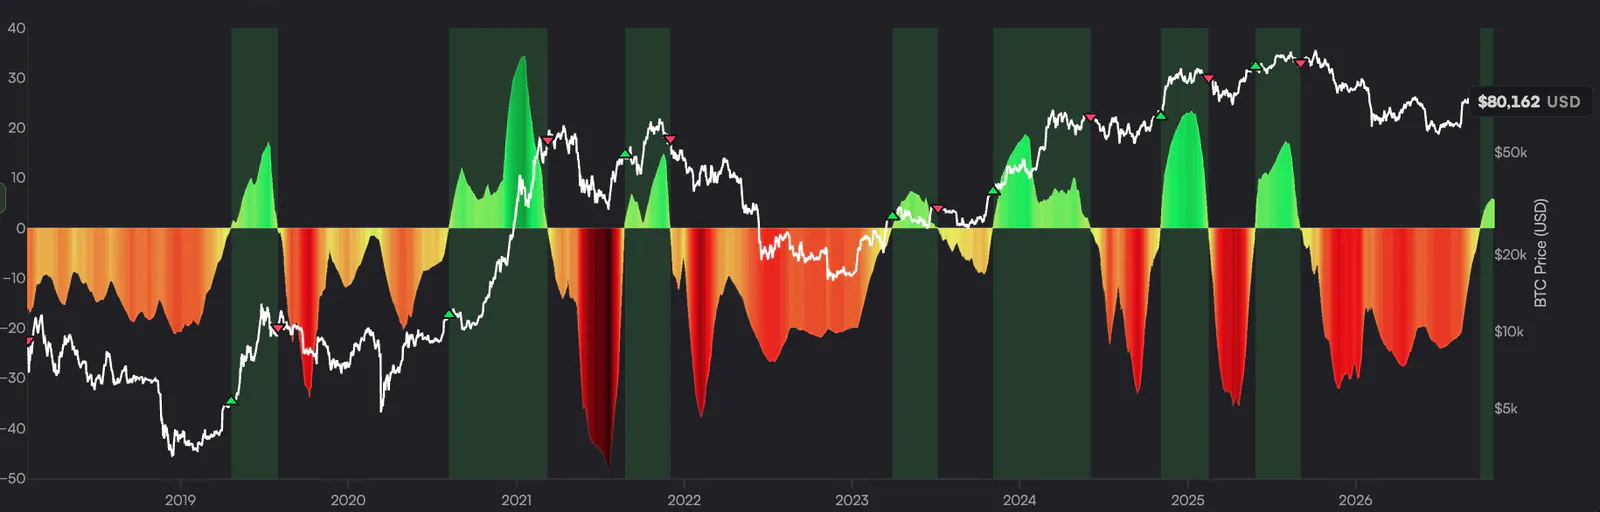
More striking still, it was invested only 30% of the time, sitting out the deepest drawdowns, exactly when you want to be out of the market. You can see this most clearly on the chart below.
That shows up in risk-adjusted returns. Return per drop came in at 1.88, versus 0.37 for holding and 0.45 for DCA, roughly 5x better than simply holding. It also compounded at 58% in bull markets and almost 35% in bear markets. Most approaches do well in one and struggle in the other, and that narrow gap is what really separates it from the benchmarks.
Leverage, and Trying to Break It
My personal opinion is that most people shouldn't touch leverage. It magnifies mistakes just as readily as it magnifies gains, and for the average investor the mistakes tend to win.
Our free advanced research paper, Diversification Across Time for Bitcoin, showed that leveraging a buy-and-hold position is a generally poor idea (among many other things). When you borrow to sit through Bitcoin's deepest drawdowns, the losses compound against you just as hard as the gains compound for you.
Used tactically inside a low-drawdown strategy, however, the maths changes completely. If the strategy is built to step aside during the worst of the falls, the very thing that makes leverage so dangerous is largely taken off the table.
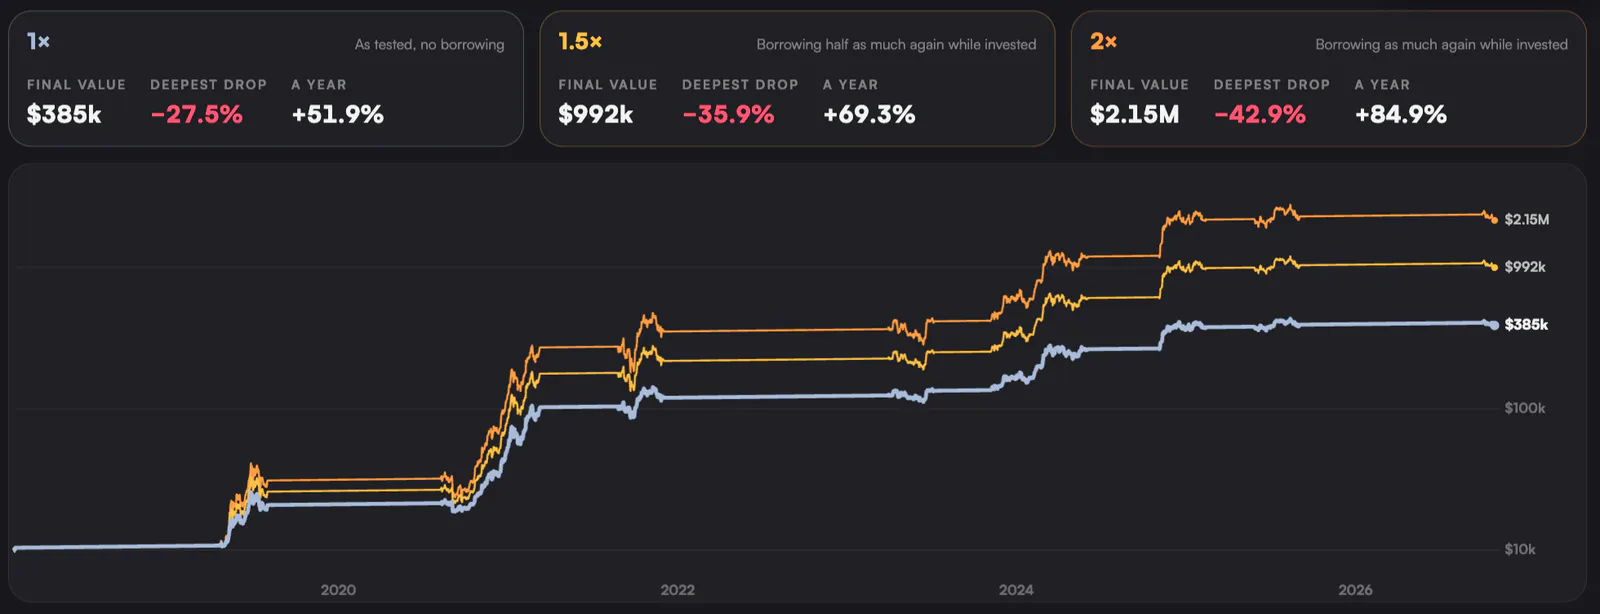
So I put that to the test. At 2x, after 8% borrowing costs, maintenance margins and liquidation fees, the portfolio grew to over $2.11 million with a -43% drawdown. That is more than 24x the return of holding with roughly half the drawdown, and return per drop rose to 1.97.
In other words, 2x leverage didn't mean 2x the pain. Because the strategy sits in cash during the worst falls, the gains are left to compound on top of each other. That is the whole point of pairing leverage with a strict rules strategy designed to avoid drawdowns rather than endure them.
Then I tried to break it. Results this strong deserve suspicion, so I deliberately made life as hard as possible for the strategy. I introduced:
- An extra 0.25% in fees per trade
- Another 10 basis points of slippage
- An extra 10% tax on all gains
- Plus filled every trade a full day late
Even with all of that stacked against it, it significantly outperformed both benchmarks. Real-world friction like this is where many promising backtests fall apart, and this one held up.
We’ve been refining the Strategy Lab heavily over the past month, and I’d encourage you to go and try it. There are now 15 strategies in there, built on 5 of the most popular models on the platform, and they keep improving all the time.
What the Crowd Is Actually Telling You
The question was never whether the Fear and Greed Index measures sentiment well. I believe it does that pretty well, and I genuinely value it. The real question was whether you can trade it the way everyone assumes you can.
On Bitcoin, the answer is mostly no.
Buying fear and selling greed tended to leave you holding through the worst of the bear markets and sitting in cash through the best of the bull runs. Even the handful of variants that did beat holding asked you to keep buying into fear that only got worse.
I don't believe most people would have stuck with that, and a strategy you can't stick with isn't really a strategy at all.
That is the uncomfortable part, and it applies to leverage too. I'm not recommending it, and most people shouldn't go near it. Not because leverage is inherently reckless here, since the data says the opposite per unit of return, but because the person running it is human. Fear sweeps through us just when we should be greedy, and greed takes hold just when we should be sitting back and watching.
The real lesson for me is this: on Bitcoin, the crowd’s mood is something to follow, not something to fight. The edge comes from stepping out of the way when that mood turns sour, not from trying to be the brave one at the bottom.
In this particular case, the contrarian story is a seductive one. The data, however, simply doesn't back it up.
I'll catch you in the next one.
Cheers,